Characterization of in situ elastic properties of gas hydrate-bearing sediments on the Blake Ridge
Characterization of in situ elastic properties of gas hydrate-bearing sediments on the Blake Ridge
This chapter was published in JGR Solid Earth: Guerin, G, D. Goldberg, and A. Melser, 1999. Characterization of in situ elastic properties of gas hydrate-bearing sediments on the Blake Ridge, J. Geophys. Res., 104(8), 17,781-17,795.
During ODP Leg 164, shear sonic velocity and
other
geophysical logs were acquired in gas-hydrate bearing sediments on the
Blake Ridge to characterize the very distinct seismic signature of such
formations: anomalous low amplitudes overlying a strong Bottom
Simulating
Reflector (BSR). A comparison of the bulk moduli derived from the logs
to standard elastic consolidation models shows that the sediments are
over-consolidated
above the BSR at 440 mbsf because of the presence of hydrates. Below
the
bottom of the thermodynamic hydrate stability zone at ~520 mbsf, the
high
compressibility of the formation and the attenuation of the monopole
sonic
waveforms are typical of sediments partially saturated with free gas.
Between
these two depths, gas hydrate and free gas seem to coexist. Within the
Gas Hydrate Stability Zone, we estimate the amount of gas hydrates
using
different models based on theories for wave scattering in multi-phase
media
and for grain cementation. In close agreement with measurements made on
discrete in situ samples, the latter describes most accurately the
interactions
between the matrix, the pore fluids and the hydrates. This model
indicates
that 5 to 10% of the pore space is occupied by hydrates deposited
uniformly
on the surface of the grains. The comparison with Gassmann's model also
show that the amount of free gas below the BSR never exceeds 5% of the
pore space, but is high enough to generate the BSR. The coexistence of
free gas and gas hydrates below the BSR may be explained by capillary
effects
in the smaller pores or by remaining crystalline structures after
partial
hydrate decomposition.
Gas Hydrates are crystalline solids formed of a cage of water molecules surrounding a natural gas molecule under specific conditions of relatively high pressure and low temperature. The supply of gas also must be sufficient to initiate and stabilize the hydrate structure [Sloan, 1990, Kvenvolden, 1994]. These restrictive thermodynamic conditions are satisfied on many continental slopes and rises around the globe, in particular on the U.S. Eastern Continental Margin.
In this paper, the qualitative analysis of the logs and of the sonic log waveforms delineates several sections with distinct characteristics associated with the presence of hydrate and free gas. The comparison of the elastic moduli of the formation calculated from the geophysical logs with the elastic formulation established by Gassmann [1951] and Hamilton [1971] shows that the hydrate-bearing sediments overlying the BSR are more consolidated, or less compressible, than normally compacting clastic sediments described by these models [Guerin et al., 1996, Guerin and Goldberg, 1997]. In order to estimate the amount of hydrate responsible for this anomalous consolidation, we compare our data to models based on numerical formulations of wave scattering in multi-phase media and of grain cementation. We use the Gassmann/Hamilton model to determine the amount of free gas beneath the BSR.
Downhole measurements are used to assess the in
situ physical, chemical, and structural properties of the formation
surrounding a borehole. After completion of drilling, probes are
lowered
into the borehole with an electrical wireline and record data at a
typical
vertical sampling interval of 15 cm. Various tools, originally
developed
for oil exploration, have been routinely deployed at most of the sites
drilled by ODP. The data recorded at Site 995 included standard
geophysical
measurements (density, resistivity, porosity, natural radioactivity) as
well as compressional- and shear-wave velocities (Vp and Vs).
Our
analysis
will
mostly
concern the data from Hole 995B since the data
recorded at Sites 994 and 997 were more severely affected by enlarged
hole
conditions.
|
|
 |
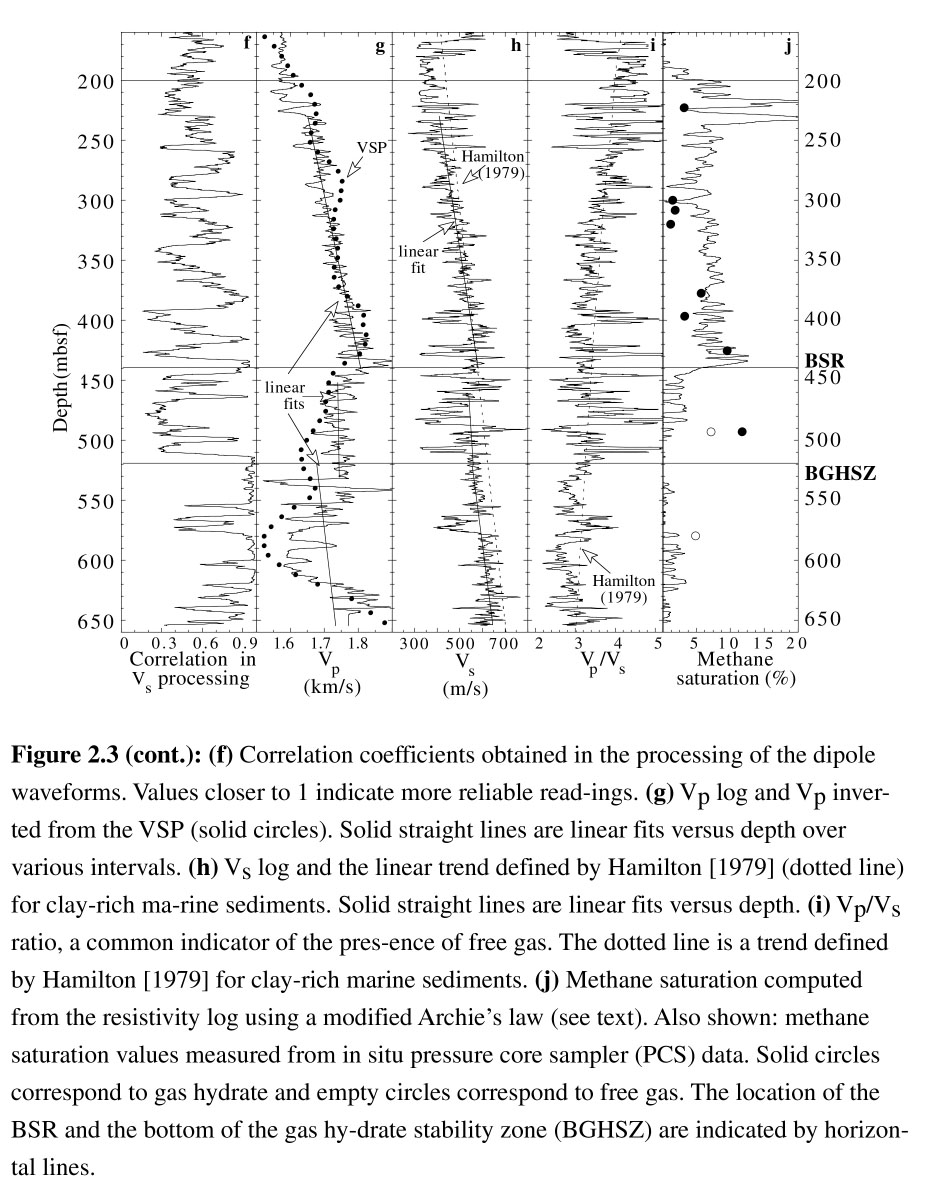 |
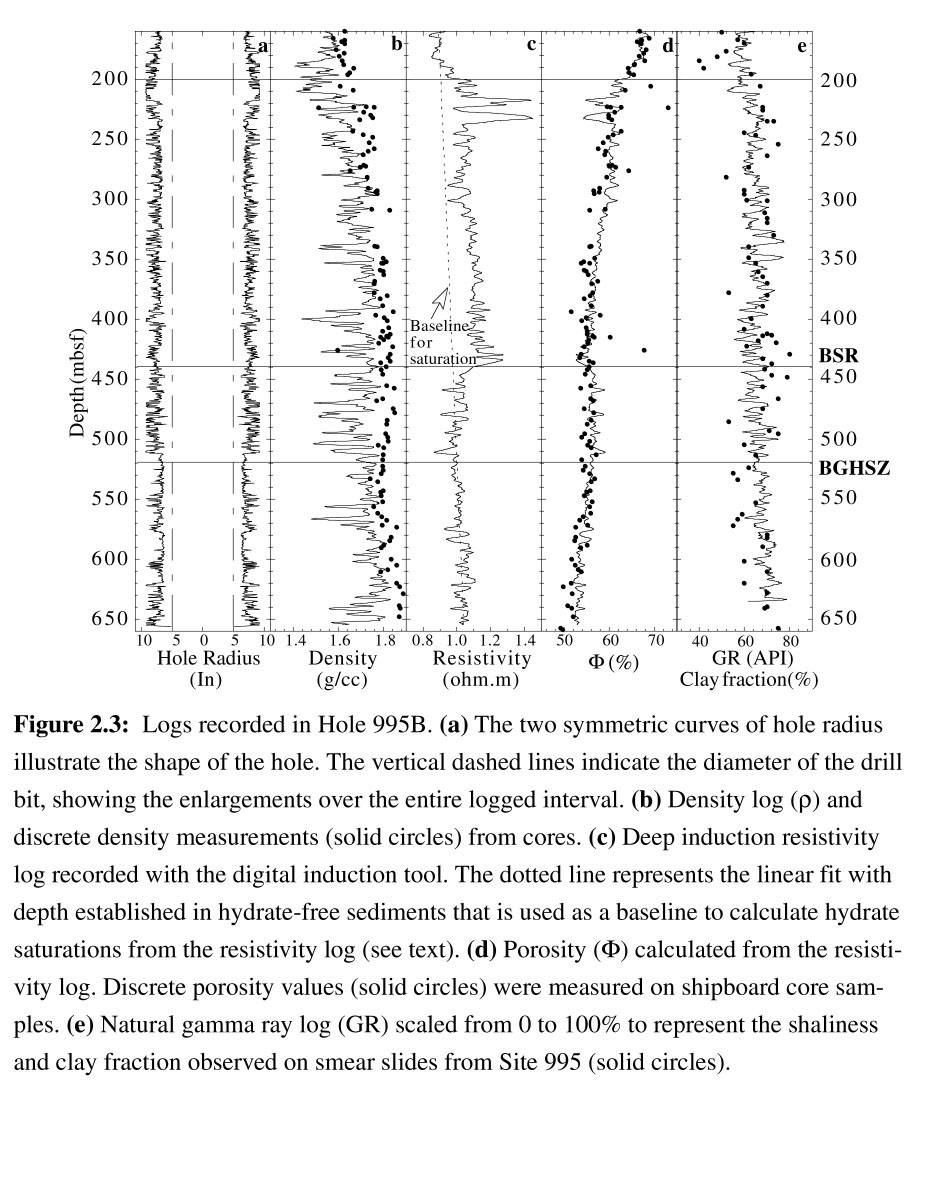
Figure 2.3 shows some of the log data recorded in Hole 995B. The caliper log (Figure 2.3a) gives an estimate of the diameter of the hole and is an indicator of the quality of the other logs - large or highly variable readings indicate likely poorer data quality. In particular, the intervals from 180 to 230 meters below seafloor (mbsf), from 390 to 410 mbsf, and several thin intervals between 460 and 510 mbsf display rugged hole conditions. The density log (Figure 2.3b) was overall affected by the enlarged hole. The log values are consistently lower than the discrete density measurements made on core samples collected in the same hole (dots), which suggests that the caliper arm had incomplete contact with the formation and that the measurements are affected by an intermediate layer of fluid. Despite these effects, the density log follows the trend of the core data with depth.
The neutron porosity log was most adversely affected by the hole rugosity and by the hydrogen bound in clay-rich sediments because it measures neutron scattering which is controlled by the total hydrogen content [Schlumberger, 1989]. As the density log was also of poor quality, the most reliable porosity estimation (Φ) was derived from the resistivity log (Figure 2.3c) which is commonly the least sensitive log to poor hole conditions [Schlumberger, 1989]. Archie [1942] established an empirical relationship between porosity, the measured resistivity (Rt) and the pore water resistivity (Rw) in sandy formations:
Rt/Rw= a/Φm or Φ = (a.Rw/Rt)1/m (1)
where m and a are two empirical parameters derived from cross-correlation between log resistivity and porosity measurements made on core samples from the same formation. The values for a and m calculated from the cores and logs collected at site 995 were respectively 0.9 and 2.7 [Paull et al., 1996]. The resistivity of seawater, Rw, was calculated as a function of temperature (T) and salinity using an empirical formula:
Rw = R0(T0 + 21.5)/(T + 21.5) (2)
where Ro is the resistivity of the seawater with the same salinity at a reference temperature T0 [Schlumberger, 1994]. The salinity was assumed to be 32 ppt, [Paull et al., 1996], yielding a water resistivity at surface temperature (T0 = 18° C) of 0.240 Ω.m [Schlumberger, 1994]. The temperature was assumed to follow a linear gradient of 38.5° C/km established by in situ temperature measurements, with a seafloor temperature of 3° C [Paull et al., 1996]. Collett [1998] and Collett and Ladd [1998] provide extensive descriptions of the different porosity estimates on the Blake Ridge. Although Archie's relationship was originally defined for sand-rich formations, Jarrard et al.[1989] observed that the effect of clay minerals is moderate in high-porosity terrigeneous sediments, and the relationship is commonly used to estimate porosity in clay-rich formations with poor borehole conditions [Collett, 1998, Jarrard et al., 1989, Srivastava et al., 1987]. The resulting porosity log is shown in Figure 2.3d, where it compares well with the discrete porosity measured on core samples at Site 995. The consistently lower porosity between ~200 and ~440 mbsf reflects the higher resistivity measured in this interval (Figure 2.3c) which is attributed to the presence of hydrates (see discussion in a later section).
The gamma ray log (GR) is a measure of the natural radioactivity of the formation, which is directly proportional to the amount of clay minerals. The log can be scaled to represent an approximation of the shaliness of the formation (0 = no shales to 100 = only shales). In Figure 2.3e this `pseudo' shaliness log can be compared with the clay minerals percentage observed on smear slides from core samples (dots) [Paull et al. 1996]. While the log does not reproduce the exact variability of the core observations, it remains in the range of the observed clay fraction. Both log and core data indicate only limited compositional changes over the entire hole [Paull et al., 1996] and give a reasonable estimate of the proportions of the principal lithological components.
In poorly consolidated sediments, when Vs is lower than the sound velocity in water, the shear waves generated by monopole acoustic sources are refracted away from the borehole and Vs can not be measured directly using conventional logging tools [Toksöz and Cheng, 1991]. On the Blake Ridge, an experimental dipole tool was deployed in which a standard monopole source (for Vp) and a wide-band dipole source are used. The dipole directional source generates flexural waves that propagate in the formation at a velocity close to Vs [Chen, 1988]. The waveforms generated by both sources are each recorded at three separate receivers (see tool geometry Figure 2.4a). Figures 4b and 4c display three sets of dipole waveforms representative of the data recorded at different depths at Sites 995 and 997. Except for the greatest depths, the waveforms recorded by the farthest receiver (3) are all very weak. The straight lines on these figures mark the detection of the flexural wave and are indicative of the velocity - steeper slopes indicate higher shear velocities. The differences between these waveforms will be discussed below.
| Figure 2.4 | 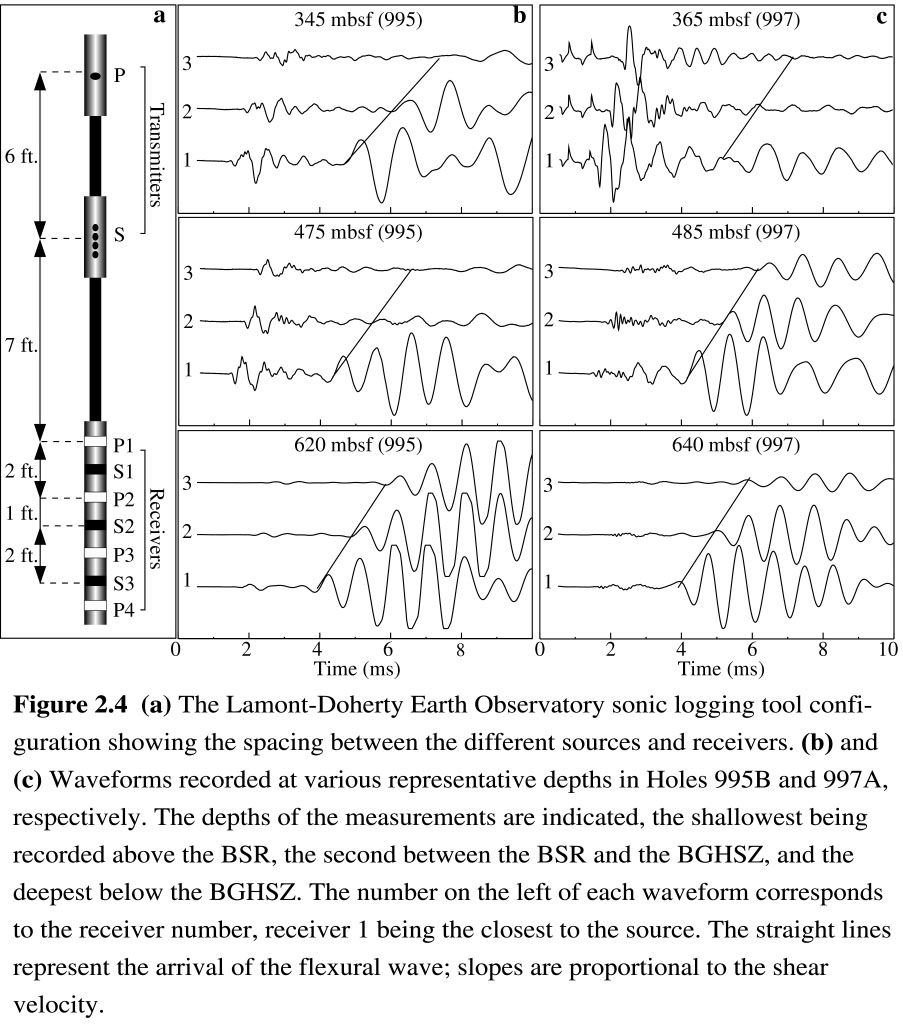 |
The Vs log was computed from the dipole waveforms by a semi-automatic cross-correlation analysis between receivers, similar to the cross correlation method described by Willis and Toksöz [1985]. A time window is selected for each trace to specify the approximate arrival time and the duration of a given event. A velocity window is specified to limit the allowable shifts on the cross correlation function, and the event's slowness is calculated by determining the shift resulting in a global maximum in the cross correlation function. This procedure was applied to the different receiver pairs (1-2, 1-3, 2-3) along the entire interval logged in Hole 995B. At each depth, we chose the value of slowness corresponding to the highest correlation coefficient. These correlation coefficients are displayed in Figure 2.3f. In most cases, the highest correlation was obtained between receivers 1 and 2, the furthest waveform being generally too weak for strong correlation (see Figure 2.4b). Low correlation values of the dipole waveforms in Figure 2.3f also generally correspond to large or irregular caliper readings (Figure 2.3a).
| Figure 2.5 | 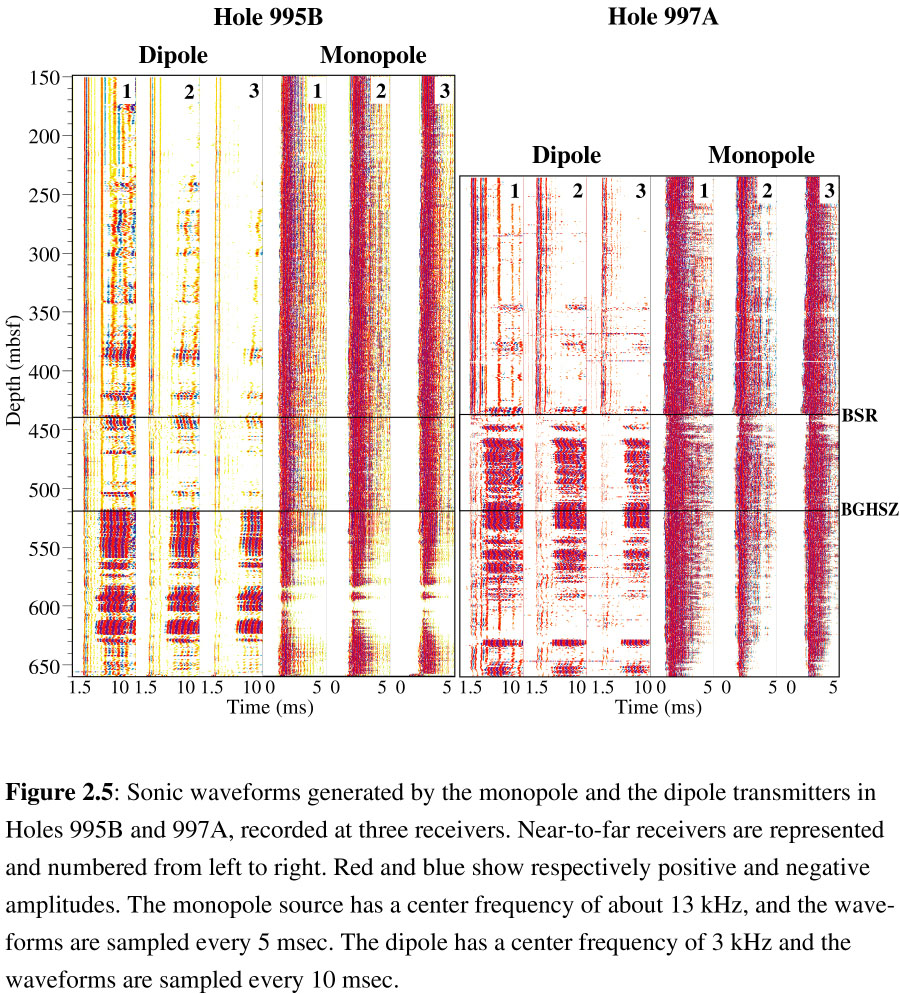 |
The entire set of monopole and dipole waveforms recorded in Holes 995B and 997A are shown in Figure 2.5, where red and blue colors indicate positive and negative amplitudes, respectively. Despite the poorer hole conditions in Hole 997A, some significant similarities and differences can be seen between the waveforms at the two sites. At both sites, the dipole waveforms recorded by receivers 2 and 3 are extremely attenuated in the upper part of the hole and show a distinct increase in amplitude with depth. This change occurs at ~440 mbsf in Hole 997A and at ~530 mbsf in Hole 995B. Below these depths, the monopole waveforms are more attenuated than in the overlying units, most noticeably between 530 and 630 mbsf in Hole 995B and below 600 mbsf in Hole 997A. The most significant differences between the two sites occur between 440 mbsf and 530 mbsf, where the dipole waveform recorded by receivers 2 and 3 have high amplitudes in Hole 997A and low amplitudes in 995B. In Figure 2.4, this is seen more clearly by comparing the waveform recorded at 475m in Hole 995B (Figure 2.4b) and at 485 m in 997 (4c). The monopole waveforms in Hole 997A are also slightly attenuated between 440 and 480 mbsf. Hole 995B does not show an equivalent feature. These comparisons indicate different elastic properties at the two sites immediately below ~440 mbsf, which is the depth of the BSR [Paull et al., 1996].
The Vp and Vs logs derived from the waveforms recorded in Hole 995B are shown in Figures 3g and 3h, respectively. The Vp log values are similar to interval velocities interpreted from offset VSP experiments (dots) reported by Holbrooket al., [1996]. Vs values less than 800 m/s were measured over most of the logged interval and are too low to have been recorded with a monopole source. The Vs log has a slightly higher gradient with depth above the BSR than the trend compiled by Hamilton [1979] for marine clastic sediments (dotted line). Bellow 440 mbsf, Vs follows the Hamilton trend, with value systematically lower than this reference profile. To our knowledge, these data represent the first open hole shear wave log ever recorded in hydrate-bearing sediments. In Figure 2.3j, we also show the Vp/Vs ratio, which is often used as an indicator of free gas [Hamilton, 1979]. The good comparison of Vp/Vs with the trend defined by Hamilton [1979] for marine clastic sediments (dotted line) suggests that the Blake Ridge sediments follow an overall normal trend with depth.
The qualitative interpretation of the logs and
sonic
waveforms in Figures 2.3 and 2.5 delineates four intervals with
distinct
signatures:
(I)
above
~200
mbsf
(II)
between
~200
and
~440 mbsf
(III)
between
~440
and
~520 mbsf
(IV)
below
~520
mbsf
The velocity gradients in these intervals are compiled in table 1.
In (I), the sediments are unconsolidated and the caliper log shows extremely poor hole conditions. No clear trend or correlation between the different logs is observed.
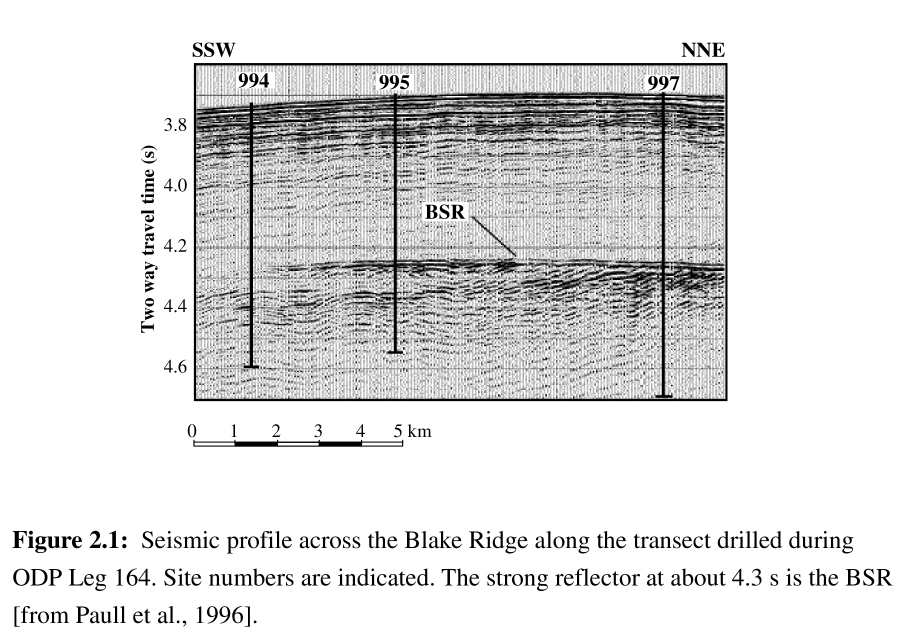
In (II), initial visual inspection, chemical analysis, and thermal measurements on the recovered cores, as well as pressurized samples collected with the Pressure Core Sampler (PCS) all indicate that gas hydrate is disseminated in the pore space throughout the formation [Paull et al. 1996; Dickens et al., 1997]. A conversion from travel time to depth using the Vp log [Paull et al., 1996] shows that the seismic blanking described in Figure 2.1 extends over this interval. Both Vp and Vs increase more rapidly with depth than in the other intervals (see Table 1). Although Vs values remain lower than the Hamilton [1979] profile, the gradient (0.817 s-1) is higher than in the Hamilton curve (0.58 s-1, see Table 1). The high Vp and Vs gradients are interpreted to reflect an enhanced consolidation associated with the presence of hydrates within this interval.
The top of (III) corresponds to a strong decrease in Vp in both log and VSP data. Paull et al. [1996] attribute this decrease to the presence of free gas. The Vs gradient over this interval is lower than in the overlying unit and follows the trend of Hamilton [1979] (see Table 1) but there is no sharp decrease in Vs matching the change in Vp. Note that the low values of Vs between 470 and 490 mbsf are associated with low waveform correlation under degraded hole conditions and are not reliable (see correlation coefficient and caliper in Figure 2.3a). Anstey [1991] points out that the presence of free gas should not significantly affect the shear velocity of water-saturated marine sediments, as neither fluid transmits shear energy. The observation of a strong decrease in Vp with no clear change in Vs supports the interpretation of the presence of free gas in this interval. However, while the presence of free gas should cause a drop in Vp/Vs [Hamilton, 1979], the curve in Figure 2.3i does not decrease, suggesting that unit (III) has a mechanical behavior different from `normal' partially gas-saturated sediments. Table 1 indicates that the lowest Vp and Vs gradients at Site 995 were measured in this unit, perhaps indicating the increasing dissociation of hydrates with depth, that would deprive progressively the sediments from the enhanced consolidation that they had while in the core of the Hydrate Stability Zone. The nature of this transition zone will be discussed farther.
Although core observation, chloride analysis of pore fluid samples, and core temperature measurements did not indicate gas hydrate below 440 mbsf, the theoretical thermodynamic Gas Hydrate Stability Zone (GHSZ) is predicted by heat flow measurements to extend to ~540 mbsf [Paull et al., 1996]. While the logs display differences across the BSR, the sonic waveforms have the same character in unit (III) as in unit (II): strong monopole waveforms and attenuated dipole. If, in particular, the strong attenuation of the dipole waveforms is indicative of the presence of hydrates above the BSR, some hydrates are also present in this deepest part of the GHSZ.
In (IV), the strong attenuation of the compressional waveforms and the high amplitude of the shear waveforms can be explained by the presence of partially gas-saturated sediments. Murphy [1982] made observations of similar phenomena in laboratory experiments on partially gas-saturated sediments. In this interval both log and VSP values show that Vp is anomalously low, particularly between 440 and 620 mbsf, and that Vp/Vs decreases significantly below ~530 mbsf. These observations are characteristic of normally consolidated sediments that are partially gas-saturated, but do not contain hydrates.
2.3.3 Porosity correction and gas hydrate saturation from resistivity log
Assuming that the higher log resistivity observed in interval (II) is caused by the presence of electrically resistive gas hydrates, the fractional hydrate saturation in the pore space (S) can be expressed as a function of the ratio of the measured resistivity (Rt) to the resistivity of the same formation saturated with water (R0). This is given by a modified version of Archie's relation :The volume of methane recovered from each Pressure Core Sampler (PCS) core was used to calculate discrete in situ saturation values. The amount of methane in each sample was calculated by dividing the volume recovered by the molecular volume of methane at surface conditions (23.6 l/mol [Dickens et al., 1996]). This amount was converted to an in situ volume of methane by multiplication by the in situ molecular volume of hydrate (136.2 cm3/mol [Dickens et al., 1996]) or of free gas, depending on the depth of the sample. The molecular volume of free gas was calculated from in situ pressure and temperature assuming a perfect gas behavior. The methane saturation is the ratio of the in situ methane volume to the total pore space measured in the PCS core. Between the BSR and the bottom of the GHSZ, two possible methane saturations can be calculated, depending on whether the recovered methane is present as hydrate or as free gas. The various in situ methane saturation estimates and the saturation derived from the resistivity log are shown in Fig 3j. As anticipated, the saturations computed from the resistivity log above the BSR are systematically higher than the PCS-derived hydrate saturation values (filled circle).
In interval (II), the presence of electrically-insulating hydrates decreases the connectivity between the pores and increases the bulk resistivity of the formation (Figure 2.3c). Archie's formulation [Archie, 1942] applied to the resistivity log then underestimates the porosity in this unit (see Figure 2.3d). In order to compensate for this effect, we use the hydrate saturation (S) calculated using Eq. (3) to correct the porosity in this interval. Assuming that the hydrates increase the resistivity only by occupying part of the pore space, the "corrected" porosity Φc can be calculated from the value estimated by Archie's law Φ by Φc = Φ/(1 - S). This corrected value of the porosity is used in the elastic models described later.2.4 Elastic Moduli of Hydrate-bearing sediments
While the qualitative analysis of the Vp and Vs logs suggests increased lithification within hydrate-bearing sediments, the characterization of the quantitative mechanical changes requires a more complete analysis of the elastic properties of the formation. The bulk (K) and shear (G) moduli can be used to directly relate changes in lithology and lithification to mechanical properties. They integrate Vp, Vs and r and can be calculated from the log data using :| Figure 2.6 |
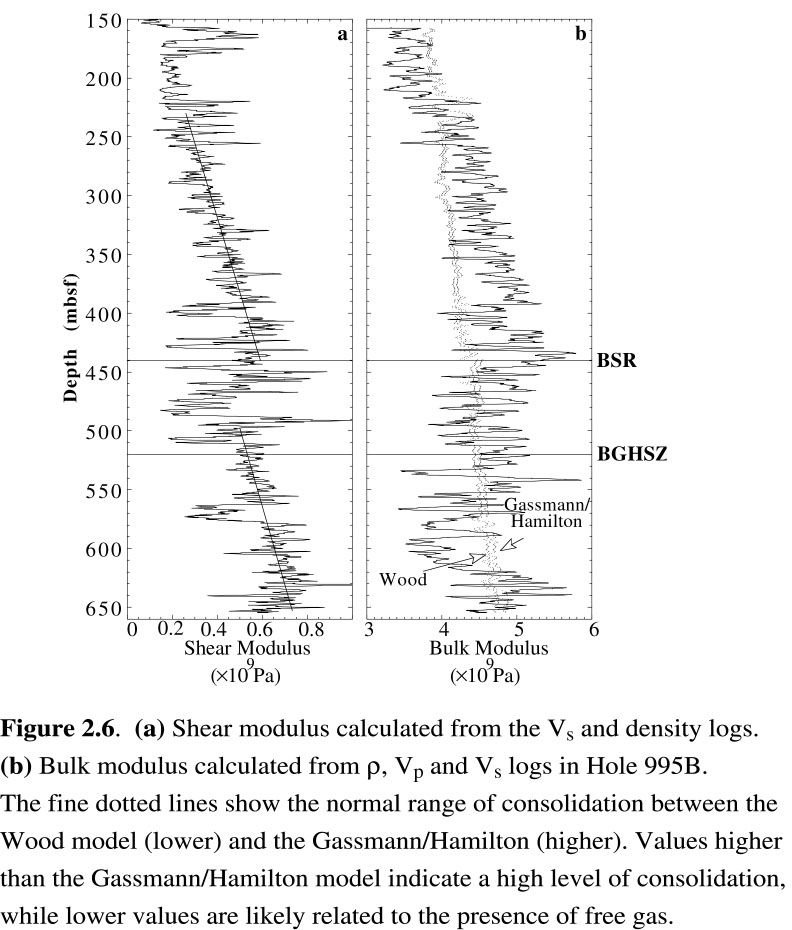 |
The shear modulus calculated from the Vs and r logs and Eq.(4a) is shown in Figure 2.6a. Its variations are very similar to the shear velocity log as a result of the limited variability in the density log. The steady stiffening of the sediments with depth and slightly higher rigidity of the hydrated sediments is illustrated by a shift between the depth gradients above 440 mbsf and below 520 mbsf. The shear modulus is not affected at greater depth by the presence of free gas [Anstey, 1991]. Figure 2.6b shows that the bulk modulus displays more noticeable variations along the logged interval, which may correspond to very distinct mechanical behavior in the different units.
We compared K to two consolidation models relating the elastic properties of the sediments to their porosity and degree of lithification. Wood [1941] and Gassmann [1951] derived models which represent two end-members of the consolidation process of sediments, ranging from the suspension of particles in water (Wood) to consolidated sediments (Gassmann). The model originally described by Wood [1942] has been widely used [Guerin and Goldberg, 1996, Wilkenset al., 1992, Hamilton, 1971] and describes the mechanical behavior of unconsolidated sediments as particles in suspension. The compressibility (inverse of the bulk modulus) of such formations is given by a weighted average of the compressibilities of the grain aggregate (Kg) and of the pore fluid (Kw):
Gassmann [1951] established a relationship also widely used [Guerin and Goldberg, 1996, Hamilton et al., 1982, Hamilton, 1971] expressing the bulk modulus of sediments as a function of the pore fluid and grain properties and of the porosity of the formation. In this formulation the bulk modulus of the dry sediments is defined as the frame bulk modulus (Kf), which results from the interaction between grains, and the bulk modulus of the saturated sediments is calculated by:
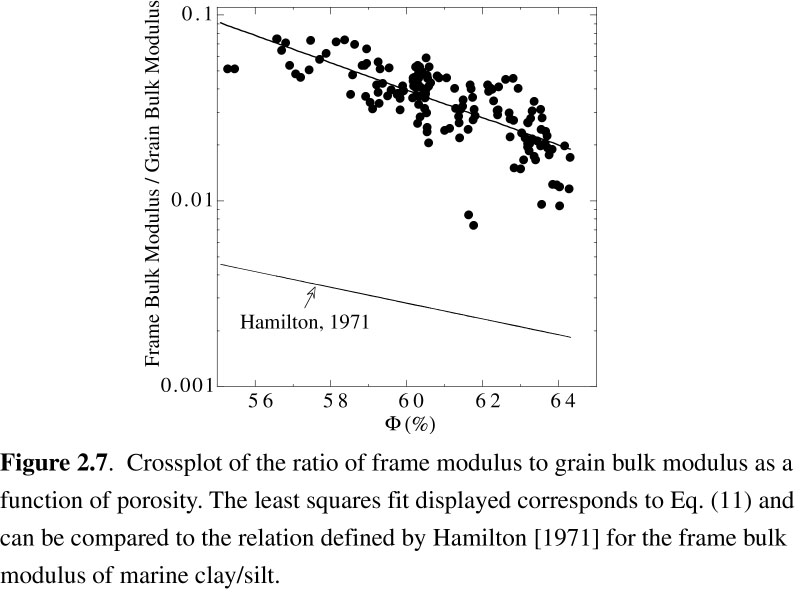
Hamilton [1971] compiled a large amount of laboratory marine sample data to establish a relationship between the frame bulk modulus and the porosity of marine sediments. In particular, he defines the two following relationships for respectively silt clays and for fine sands:
and log(K f(x 10-9 Pa)) =1.70932 - 4.25391Φ (7b)
The aggregate grain bulk modulus (Kg) in the Wood and Gassmann/Hamilton models can be calculated by a Voigt-Reuss-Hill average of the grain moduli of the two main mineral phases, sand (Ks) and clay (Kc) [Hamilton, 1971]. Using the normalized Gamma Ray values (g) to define the clay mineral percentage in these sediments (see Figure 2.3e) and grain moduli values in Table 2, the grain bulk modulus can be calculated by:
We calculate the predictions of the Wood and Gassmann/Hamilton models at Site 995 to define an expected range of compressibility for the Blake Ridge sediments. In normal sediments, the degree of consolidation may be indicated by the closeness of the measured bulk modulus to either the Wood (unconsolidated) or Gassmann/Hamilton (consolidated) model [Guerin and Goldberg, 1996]. Because these sediments were deposited extremely quickly [Paull et al., 1996], their porosity is very high and the range between these two models is particularly narrow. This is illustrated by the very narrow range between the two fine dotted lines in Figure 2.6, representing respectively Wood's and Gassmann/Hamilton's models.
Above 250 mbsf, the bulk modulus is roughly in the range of the two models. The fluctuations can be likely attributed to poor hole conditions, rather than to consolidation differences. Below 520 mbsf, the presence of free gas reduces the bulk modulus to values lower than either model, which both assume the pore fluid to be water. Between these two depths, and more distinctly above 440 mbsf the measured bulk modulus is significantly greater than the Gassmann/Hamilton model [Guerin et al., 1996, Guerin and Goldberg, 1997]. Considering in addition that the poor log density data likely result in an underestimation of the bulk modulus, the anomalously high estimate may be due to the presence of hydrates. Below the BSR, the measured bulk modulus remains generally higher than the Gassmann/Hamilton model despite the indications that free gas is present. We interpret this to indicate that the elastic and mechanical properties of the sediments at Site 995 are dominated by the influence of hydrates down to the bottom of the GHSZ.
Considering that the sediments in unit (II) (~200 to 440 mbsf) are consolidated and that a frame bulk modulus exists, Eq. (6) can be reworked to calculate the frame bulk modulus when the bulk modulus of the saturated sediments is known:
These data can be fit by a logarithmic relationship similar to Eq.(8):
log(Kf/Kg) = 3.02 - 7.372F (regression coefficient = 0.734) (11).
In order to define a statistically significant relationship, only data where the coherence of the shear wave processing was high (>0.7) are used. Figure 2.7 shows that the frame modulus of hydrated sediment is about 20 times higher than the frame modulus of normal clastic sediments of the same porosity. The limited porosity range on the Blake Ridge (50-70 %) and the relatively low regression coefficient in Eq. (11) do not allow to extrapolate this equation much beyond this range. However we speculate that for low (0-20%) porosities, the strong interactions between grains will not be additionally increased by the presence of hydrates, whose elastic moduli are lower than those of the grains, and that the expression of the frame modulus becomes closer to Eq.(8) at very low porosity. At high (>80%) porosity, particles, grains and hydrates, are merely in suspension in water, having little rigidity [Wood, 1942]. Under these conditions, the influence of hydrates on the elastic moduli should also decrease at very high porosity.
2.5 Methane Saturation from elastic moduli
The deviation of the frame bulk modulus from the Hamilton trend shows that the presence of hydrates affects the interaction between grains and transforms the elastic moduli of the Blake Ridge sediments. Various existing models may be used to describe the elastic properties of a formation as a function of hydrate concentration. These models differ primarily by their assumption of how hydrates are arranged within the pore space.
Following Kuster and Toksöz [1974], Zimmerman and King [1986] and Lee et al. [1996] have formulated the propagation of seismic waves in hydrate- or ice-bearing unconsolidated sediments in terms of wave scattering through a three-phase medium. The formation is represented by spherical clay grains embedded in a matrix composed of spherical inclusions of water within an hydrate or ice framework. For a two-phase medium composed of spherical inclusions within an uniform matrix, the effective bulk and shear moduli are given by Kuster and Toksöz as:
and ![]() (13),
(13),
| Figure 2.8 | 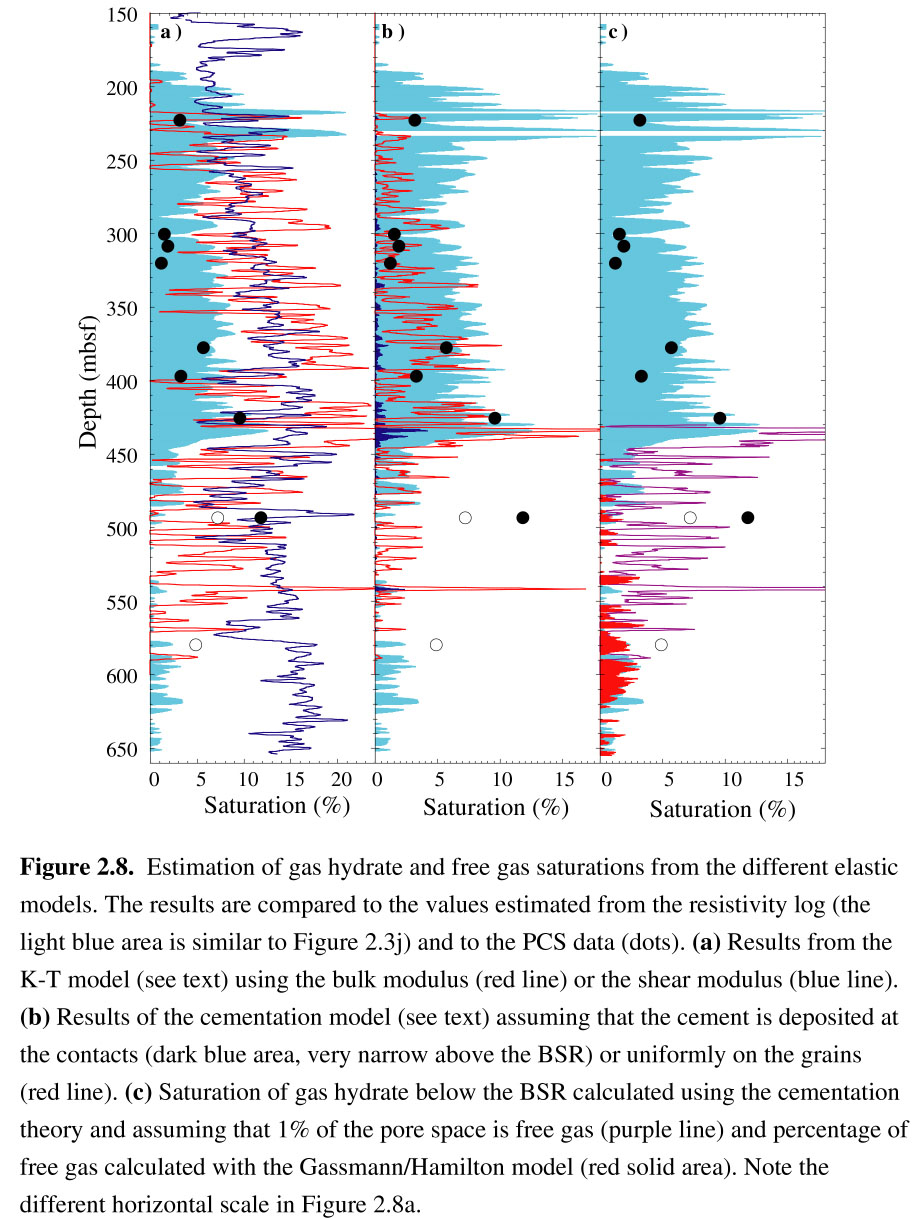 |
An alternative model may be used which focuses on the interaction between the grains and hydrates acting as an intergranular cement [Dvorkin et al., 1991 and 1994; Dvorkin and Nur, 1996]. It is based on the estimation of the shear and normal stiffness of two-grain combinations with elastic cement at the contact. The frame is assumed to be a random pack of identical spherical grains, with an estimated average of n contacts per grain. The effective dry-rock bulk modulus (Keff) is defined by Dvorkin and Nur [1996] as:
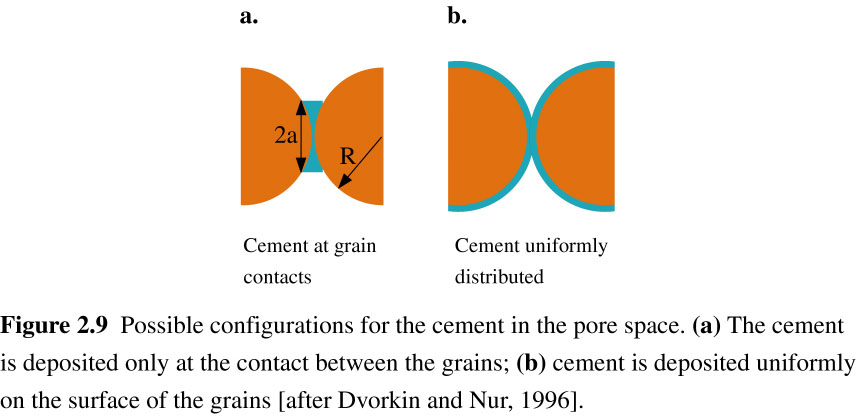
In this configuration, a can be related to the hydrate fraction in the pore space (S) by :
![]() (15a).
(15a).
Since Eq.(14) is defined for dry sediments, we use Eq. (10) to calculate the effective dry bulk modulus Keff from our measured values of K and F. Assuming an average value of n = 9 contacts per grain [Dvorkin and Nur, 1996] and using the porosity log and the parameters in Table 2, we incrementally increase the hydrate concentrations in the two expressions of Eq.(15), and subsequently the stiffness Sn in Eq.(14), to match Keff = Kf. Figure 2.8b shows the methane concentration from hydrate estimated by the cementation theory for the two different a values. Above the BSR, the best agreement with the PCS data is provided by the model assuming an uniform distribution of hydrate around sediment grains [Guerin and Goldberg, 1997].
To estimate the hydrate content where hydrates and free gas might coexist below the BSR, we applied the same procedure using the bulk modulus of a mixture of water and 1% gas for the fluid bulk modulus (see below for the methodology of fluid elastic moduli calculation). This gives the amount of hydrate that would be necessary to reproduce the observed data if as much as 1% of the pore space was occupied by free gas. The resulting hydrate saturation below 440 mbsf is shown in Figure 2.9c. These values compare well with the saturations estimated from the recovered PCS samples below the BSR.
Of the different hydrate saturation estimates derived from the logs, the best agreement with the PCS measurements is obtained with the cementation theory assuming a uniform hydrate distribution surrounding the grains (Figure 2.8b). All of the models suggest that hydrates are present down to ~520 mbsf, about 80 meters deeper than the BSR, and coexist with some free gas in this interval. We conclude therefore that the BSR marks the top of free gas occurrence rather than the bottom of the hydrate stability zone.
2.6 Determination of the free gas concentration
Quantifying the free gas accumulation below the GHSZ is also crucial to the estimation of the total gas reserves on the Blake Ridge. For this, we again use the velocity logs and existing elastic wave models. Below 520 mbsf, the caliper log shows good hole conditions and the waveforms display high coherence, indicating that the bulk modulus reliably reflects changes in lithology or in the pore fluid. Because the gamma ray log remains relatively uniform, the strong variations in bulk modulus likely results from the presence of free gas, as discussed by Paull et al. [1996].
Murphy [1984] calculates the change in pore fluid compressibility due to the presence of free gas by a weighted average of the fluid moduli, assuming that the relative configuration of the fluid phases has no effect on the velocities. This may be expressed by:
![]() (16)
(16)
Sgas estimates agree well below 520 mbsf with the methane saturation derived from the resistivity log using the modified Archie formulation (the blue area between 570 and 630 mbsf in Figures 2.8a,b,c). This is expected since the Archie relationship was originally derived for empirical estimations of free gas [Schlumberger, 1989]. Below the GHSZ, no hydrate is present and a free gas relationship fully applies.
| Figure 2.10 | 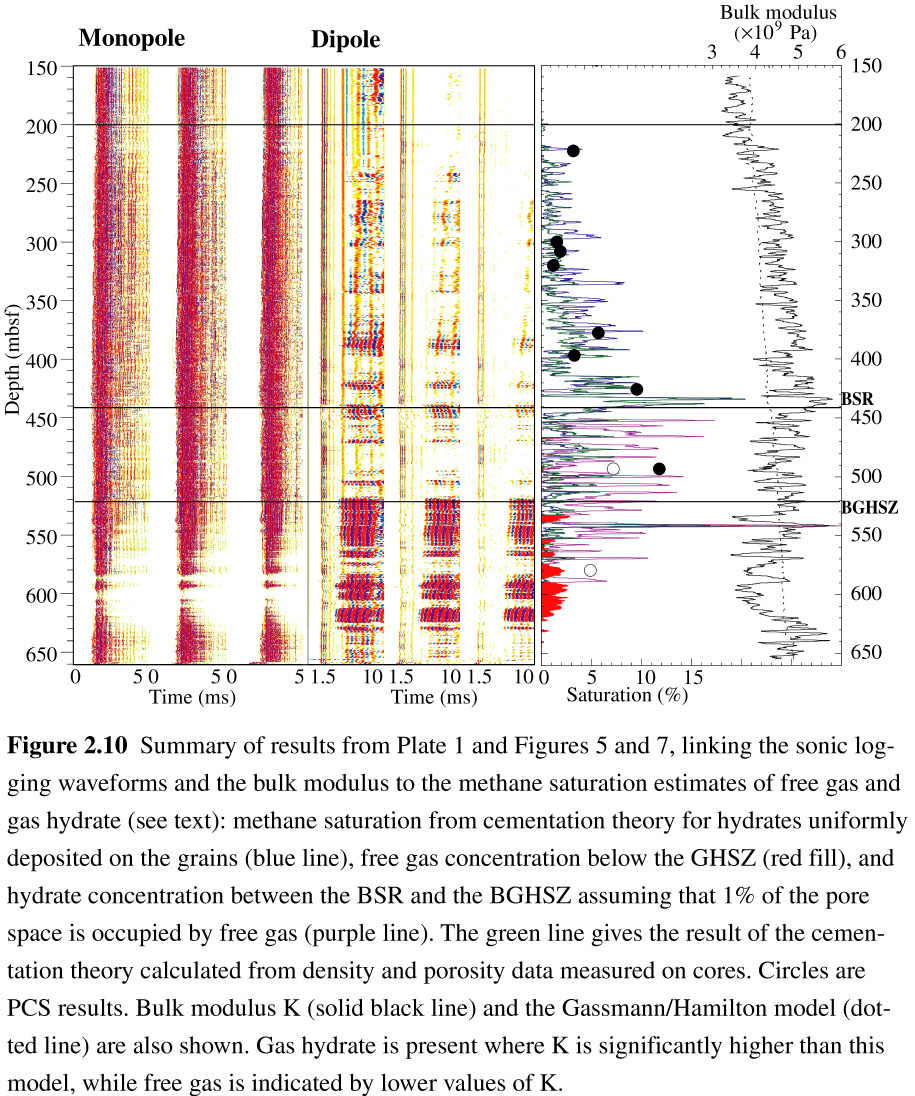 |
2.7.1 Quality of the logging data
Figure 2.10 summarizes the changes in sonic waveforms and bulk modulus in Hole 995B and a combined estimate of the total methane distribution. Because of the poor quality of the density data and of the limitations of Archie's law in clay-rich sediments to calculate porosity, it is necessary to estimate the possible error resulting from the use of these values in our estimation of the moduli and of hydrate saturations. For this purpose we have used the density measured on core samples at Site 995 [Paull et al., 1996] to re-calculate the elastic moduli of the sediments and thereafter we used the porosity measured on cores to re-estimate hydrate saturations with the K-T model and the cementation theory. Both density and porosity are sampled at a lower resolution on core than in logs, hence the discrete data were interpolated between intervals to the closest measured value.
The resulting hydrate saturations were generally slightly lower using core than log data, however we reach the same conclusions regarding the general distribution of hydrates with depth. The cementation theory best describes the elastic properties of hydrate-bearing sediments on the Blake Ridge with either data set. In Figure 2.10, we compare the results of the cementation theory calculated with the core data (green curve) to the results derived from the log (blue line, as in Figure 2.9b) for the case of hydrates being uniformly distributed on the grains. The difference between the two curves is less than 5%, and they show similar hydrate distribution with depth.
2.7.2 Comparison of the Models
Qualitatively, all the models indicate the presence of hydrates to ~520 mbsf at Site 995. Quantitatively, they produce considerably different methane saturation values. We use the values derived from the PCS data as a reference for comparison. As noted earlier, the insulating properties of hydrates cause methane saturation derived from the resistivity log to be systematically higher than the PCS values. Results of the K-T model are even higher. Lee et al. [1996] also concluded that the K-T model overestimated hydrate concentrations and they proposed a weighted equation as a more accurate and versatile alternative. We interpret the high estimates of the K-T model as a consequence of its statistical treatment of elastic waves propagation which does not account for the interactions between inclusions [Kuster and Toksöz, 1974]. Without such interaction, hydrates increase the bulk modulus by partially replacing water within the pore space, increasing only the value of the pore fluid modulus in Eq.(12). This process requires more hydrate to produce the same consolidation than by stiffening the matrix frame modulus at the grains contacts. Because the frame bulk modulus of hydrate-bearing sediments may 20 times higher than in hydrate-free sediments (see Figure 2.7), the K-T model does not completely describe the effects of hydrate deposition on grain interactions and elastic wave propagation.
The cementation theory of Dvorkin and Nur [1996] agrees well with saturation estimates from the PCS when hydrates are assumed to uniformly coat grains, but very low values are obtained when hydrates are assumed to be only at the grain contacts. However, since the Blake Ridge sediments are clay-rich, they are not well represented by spherical grains, as this model assumes, and this single data set does not allow us to discriminate confidently between the two end-member configurations. In addition, this theory was actually developed and experimentally tested in sands with lower porosity (less than 36%) [Dvorkin and Nur, 1996]. Therefore, additional data in a variety of lithologies and porosity ranges, particularly in hydrate-bearing sands, are necessary to determine conclusively the actual hydrate-grain configuration. A combination of coated grain surfaces and grain contact cementation may be realistic. At this stage we consider the results of the cementation theory for uniformly hydrate-coated grains as the most accurate of our estimates of methane saturation near Hole 995B.
Ecker et al. [1996] applied the cementation theory to velocities derived from seismic by AVO analysis and concluded that hydrates form in the open pore space away from either grain contacts or surfaces. The reason for this interpretation is that the shear velocity values derived from AVO analysis are lower in the hydrate-bearing sediments than below the BSR. Such low values are not observed in the Vs log. Additional in situ Vs logs across other BSR's are needed to resolve this difference.
2.7.3 Coexistence of hydrates and free gas from logs at Site 995
Figure 2.10 summarizes the various indications from elastic data that gas hydrate is present below the BSR down to ~520 mbsf. Paull et al. [1996] and Dickens et al. [1997] conclude from chlorinity dilution profiles that gas hydrate is present only above ~440 mbsf. Our extension of this zone to the BGHSZ is based on four key observations: (1) Neither the monopole or the dipole waveforms display any change across the BSR at ~440 mbsf. In particular, the dipole waveforms remain strongly attenuated as in the hydrate-bearing sediments above the BSR. The strong attenuation of shear waveforms without attenuation of the compressional waveforms can be attributed to slight partial free gas saturation [Murphy, 1982]. The main change in the character of the waveforms, and in the elastic properties of the formation, occurs below ~520 mbsf where the dipole amplitudes increase and the monopole waveforms become attenuated, indicating higher free gas saturation. (2) Above 520 mbsf, the bulk modulus remains generally higher than the Gassmann/Hamilton model. It decreases to lower values below this depth, which is characteristic of the influence of free gas. Therefore, between the BSR and 520 mbsf, the bulk modulus and the sonic waveforms have characteristics similar to the hydrate-bearing sediments above the BSR. Below 520 mbsf both waveforms and bulk modulus are typical of the influence of free gas. (3) The single methane saturation value from the PCS between 440 and 520 mbsf (8% from one sample at 493 mbsf) is at least four times higher than the values (<2%) derived from the Gassmann/Hamilton model. If the amount of methane sampled was present as free gas in this interval, the measured bulk modulus would be much lower. (4) Finally, there is no lithological or structural change between the BSR and 520 mbsf, and no obstacle to the upwards migration of free gas. The presence of hydrates in part of the pore space above 520 mbsf may reduce the bulk permeability of the sediments and trap free gas below this depth as it migrates upwards.
2.7.4 Mechanisms for coexistence of hydrates and free gas
Ruppel [1997], Hovland et al., [1997] and Clennellet al. [1995] reported a difference between the depth of the BSR and the theoretical bottom of the GHSZ. They associate this discrepancy with capillary forces that develop in fine grained sediments and reduce the temperature where hydrates dissociate. Hovland et al. [1997] underline that hydrates preferably initiate in larger pore space, and, reciprocally, dissociate first in smaller pores with strong capillary effects. In the interval between the BSR and the bottom of the GHSZ, therefore, hydrates in smaller pores may have dissociated and released free gas, while they remain present within the larger pores. The two phases would then coexist in this interval.
The coexistence of hydrates and free gas also proceeds as a normal stage during hydrate dissociation. Christiansen and Sloan [1994] describe the progressive heating in a reactor of synthetic hydrates and observe that "as the system is heated, visible hydrate agglomerates decompose into the liquid and vapor phase, but quasi-crystalline metastable cluster structures remain in the liquid up to a certain degree of heating". Similarly, as sediments accumulate on the Blake Ridge and the BSR slowly migrates upwards, progressive heating and dissociation of hydrates would tend to create an interval where both crystalline and vapor gas coexist.
Also, since methane solubility in water increases with depth within the GHSZ [Zatsepina and Buffet, 1997], the pore fluid above 520 mbsf should be oversaturated with methane compared to the deeper sediments and the occurrence of free gas should be favored.
2.7.5 Comparison between Sites 994, 995 and 997
The coexistence of free gas and gas hydrates over 70 meters below the BSR on the Blake Ridge may explain some of the differences in seismic character at Sites 994, 995 and 997. The bad hole conditions at Site 994 did not allow the recording of reliable Vs data, but our analysis and the characteristics of the BSR at Site 995 suggest that it represents an intermediate location, and perhaps an intermediate process, between the other two sites (see Figure 2.1). At Site 997, the BSR at 4.25 sec (two-way travel time) is strong and immediately underlain by high seismic amplitudes for more than 100 milliseconds. At Site 994, there is no BSR and low seismic amplitudes persist to ~4.32 sec twtt (e.g. ~530 mbsf) [Paull et al., 1996]. Since heat flow values are similar at the three sites (34-36 mW/m2 [Paull et al, 1996]), the theoretical GHSZ extends to the same depth and gas hydrates may be present to at least 520 mbsf. The differences between the three sites may be explained by the absence or presence of, and the amount of, free gas. The low seismic amplitudes to ~530 mbsf at Site 994 may indicate that gas hydrate is present to this depth, but that any free gas, either rising from a deeper source or resulting from gas hydrate dissociation, is driven past the south-west edge of the BSR through the numerous faults described by Dillon et al. [1996]. Lateral gas migration along such faults may also reduce the accumulation of free gas at Site 995. In contrast, the location of Site 997 on the topographic crest of the Blake Ridge favors the structurally-controlled accumulation of free gas, which is responsible for the high seismic amplitude below the BSR and for the high amplitude of the dipole waveforms below 440 mbsf in Hole 997A (Figure 2.5, see also Figure 2.4c at 485 mbsf). Besides a 40 m-thick interval below 440 mbsf, the monopole waveforms at Site 997 are not significantly attenuated between 440 mbsf and 550 mbsf. Hence, either the stiffness of the sediments is maintained by the occurrence of some hydrates to this depth despite the presence of free gas or the amount of free gas is not high enough to attenuate the monopole waveforms [Murphy, 1982]. In summary, at Site 997, a high concentration of free gas responsible for the attenuation of the monopole waveforms occurs from 440 to 480 mbsf. Between 480 and 550 mbsf, hydrates and free gas coexist as at site 995, but a higher concentration of free gas increases the dipole waveform amplitudes, despite the presence of hydrates. At greater depths, and most notably below 600 mbsf, high concentrations of free gas are indicated by the strong attenuation of the monopole waveforms.
Our principal results on the distribution of methane and methane hydrate on the Blake Ridge are: (1) Hydrates appear to act as an intergranular cement and increase the rigidity and the bulk modulus of the host sediment; (2) the BSR marks the top of the occurrence of free gas, not the base of the gas hydrates; and (3) some form of hydrate exists below the BSR on the Blake Ridge, coexisting with free gas.
These conclusions are based only on the Blake Ridge dataset, recorded only in one hole under rugged marine borehole logging conditions. Additional shear sonic tool deployments are necessary, as well as further studies to refine the model for the configuration of hydrates in the pore space of clay-rich sediments. As a first step towards a better understanding, we recommend the evaluation of hydrate concentrations using in situ Vp and Vs logs in hydrate-bearing sands which correspond to the laboratory-tested models of the cementation theory.
Nevertheless, the quantification of the in situ elastic properties of the Blake Ridge hydrate-bearing sediments using cementation theory yields methane concentrations similar to in situ discrete sample measurements. The amplitudes of sonic logging waveforms are also effective qualitative indicators of the changes in the mechanical properties of the formation resulting from the presence of gas hydrates or free gas.
Archie, G.E., The electrical resistivity log as an aid in determining some reservoir characteristics, J. Pet. Technol., 5, 1-8, 1942.
Chen, S.T., Shear wave logging with dipole sources, Geophysics, 53, 659-667, 1988.
Christiansen, R.L., and E.D. Sloan, Mechanisms and kinetics of hydrate formation, in International Conference on Natural Gas Hydrates, edited by E.D. Sloan, J. Happel, and M.A. Hnatow, Ann. of the N.Y. Acad. of Sci., 715, 283-305, 1994.
Clennell, M.B., M. Hovland, D. Lysne, and J.S. Booth, Role of capillary forces, coupled flows and sediment-water depletion in the habitat of gas hydrate, Eos Transactions of the American Geophysical Union, 76(16), 164-165, 1995.
Collett, T.S., and J. Ladd, Detection of gas hydrate with downhole logs and assessment of gas hydrate concentrations (saturations) and gas volumes on the Blake Ridge with electrical resistivity log data, submitted to Proc. ODP, Sci. Results, 164, 1998.
Collett, T.S., Well log evaluation of gas hydrate saturations, Trans. SPWLA 39th Logging Symposium, paper MM 1998.
Dickens, G.R., C.K. Paull, P. Wallace, and the ODP Leg 164 Scientific Party, Direct measurements of in situ methane quantities in a large gas-hydrate reservoir, Nature, 385, 427-429, 1997.
Dillon, W.P., D.R. Hutchinson, and R.M. Drury, Seismic reflection profiles on the Blake Ridge near sites 994, 995, and 997, in Paull, C.K., R. Matsumoto, P.J. Wallace, et al., Proc. ODP, Init. Repts., 164: College Station, TX (Ocean Drilling Program), 47-56, 1996.
Dvorkin, J., G. Mavko and A. Nur, The effect of cementation on the elastic properties of granular material, Mechanics of Materials, 12, 207-217, 1991.
Dvorkin, J., A. Nur, and H. Yin, Effective properties of cemented granular material, Mechanics of Materials, 18, 351-366, 1994.
Dvorkin, J., and A. Nur, Elasticity of high-porosity sandstones: theory for two North Sea data sets, Geophysics, 61, 1363-1370, 1996.
Ecker, C., D. Lumlet, J. Dvorkin, and A. Nur, Structure of hydrated sediments from seismic and rock physics, in Proceedings, 2nd International Conference on Natural Gas Hydrates, Toulouse, 491-498, 1996.
Gassmann, F., Elastic waves through a packing of spheres, Geophysics, 16, 673-685, 1951.
Guerin, G., and D. Goldberg, Acoustic and elastic properties of calcareous sediments across a siliceous diagenetic front on the eastern U.S. continental slope, Geophys. Res. Lett., 23(19), 2697-2700, 1996.
Guerin, G., A. Meltser, and D. Goldberg, Results of acoustic and shear wave logging in gas hydrates; preliminary data from ODP Leg 164, Eos, AGU Transactions, 77(46), p. F322, 1996.
Guerin, G., and D. Goldberg, Characterization of in situ elastic properties of hydrated sediments, Eos, AGU Transactions, 78(46), p. F339, 1997.
Hamilton, E. L., Elastic properties of marine sediments, J. Geophys. Res., 76, 579-601, 1971.
Hamilton, E.L., Vp/Vs and Poisson's ratios in marine sediments and rocks, J. Acoust. Soc. Am., 66, 1093-1101, 1979.
Hamilton, E. L., Bachman, R. T., Berger, W. H., Johnson, T. C., and Mayer, L. A., Acoustic and related properties of Calcareous deep-sea sediments, J. Sed. Pet., 52(3), 733-753, 1982.
Holbrook, W.S., H. Hoskins, W.T. Wood, R.A. Stephen, D. Lizarralde, and Leg 164 Science Party, Methane hydrate and free gas on the Blake Ridge from vertical seismic profiling, Science, 273, 1840-1843, 1996.
Hollister, C.D., J.I. Ewing, et al., Init. Repts., DSDP, 11, Washington (U.S. Govt. Printing Office), 1972.
Hovland, M., J.W. Gallagher, M.B. Clennell, and K. Lekvam, Gas hydrate and free gas volumes in marine sediments: example from the Niger delta front, Mar. Petr. Geol., 14, 245-255, 1997.
Hyndman, R.D., and E.E. Davis, A mechanism for the formation of methane hydrate and seafloor bottom simulation reflectors by vertical fluid expulsion, J. Geophys. Res., 97, 7025-7041, 1992.
Jarrard, R.D., K.A. Dadey and W.H. Busch, Velocity and density of sediments of Eirik Ridge, Labrador Sea: control by porosity and mineralogy, Proc. ODP, Sci. Res., 105, p. 811-835,1989.
Kvenvolden, K.A., Natural gas hydrate occurrence and issues, in International Conference on Natural Gas Hydrates, edited by E.D. Sloan, J. Happel, and M.A. Hnatow, Ann. of the N.Y. Acad. of Sci., 715, 232-246, 1994.
Kuster, G.T., and M.N. Toksöz, Velocity and attenuation of seismic waves in two-phase media, 1, Theoretical formulation, Geophysics, 39, 587-606, 1974.
Lee, M.W., D.R. Hutchinson, W.P. Dillon, J.J. Miller, W.F. Agena, and A.B. Swift, Method of estimating the amount of in situ gas hydrates in deep marine sediments, Mar. Petr. Geol., 10, 493-506, 1993.
Lee, M.W., D.R. Hutchinson, T.S. Collett, and W.P. Dillon, Seismic velocities for hydrate bearing sediments using weighted equation, J. Geophys. Res., 101, 20,347-20,358, 1996.
Murphy, W.F, Massilon sandstone and Vycor porous glass, J. Acoust. Soc. Am., 71(6), 1458-1468, 1982.
Murphy, W.F., Acoustic measures of partial gas saturation in tight sandstones, J. Geophys. Res., 89, 11,549-11,559, 1984.
Paull, C.K., R. Matsumoto, P.J. Wallace, et al., Proc. ODP, Init. Repts., 164, College Station, TX (Ocean Drilling Program), 1996.
Pearson, C.F., P.M. Halleck, P.L. McGuire, R. Hermes, and M. Mathews, natural gas hydrates deposits: a review of in situ properties, J. Phys. Chem., 87, 4180-4185, 1983.
Pecher, I. A., W.S. Holbrook, R.A. Stephen, H. Hoskins, D. Lizarralde, D.R. Hutchinson, W.T. Wood, Offset-vertical seismic profiling for marine gas hydrate exploration; is it a suitable technique? First results from ODP Leg 164, in Proceedings of the 29th annual offshore technology conference, Dallas, TX, 193-200, 1997.
Ruppel, C., Anomalously cold temperatures observed at the base of the gas hydrate stability zone on the U.S. Atlantic passive margin, Geology, 25(8), 699-702, 1997.
Sheridan, R.E., F.M. Gradstein, et al., Init. Repts. DSDP, 11, Washington (U.S. Govt. Printing Office), 1983.
Shipley, T.H., M.H. Houston, R.T. Buffler, F.J. Shaub, K.J. McMillen, J.W. Ladd, and J.L. Worzel, Seismic evidence for widespread possible gas hydrate horizons on continental slopes and rises, AAPG Bull, 63, 2204-2213, 1979.
Schlumberger, Log interpretation principles/applications, Houston, TX (Schlumberger Educ. Services), 1989.
Schlumberger, Log Interpretation Charts, Houston, TX (Schlumberger Wireline & Testing), 1994.
Sloan, D.E., Clathrate hydrates of natural gases, Marcel Dekker, New York, 1990.
Srivastava, W.B., M. Arthur, et al., Proc. ODP, Init. Repts., 105: College Station, TX (Ocean Drilling Program), 1987.
Toksöz, M.N., and Cheng, C.H., Wave propagation in a borehole, in Shear waves in marine sediments, edited by J.M. Hovem, M.D. Richardson, and R.D. Stoll, 257-265, Kluwer Academic Publishers, 1991.
Tucholke, B.E., G.M. Bryan, and J.I. Ewing, Gas hydrate horizon detected in seismic reflection profiler data from the western North Atlantic, AAPG Bull., 61, 698-707, 1977.
Wilkens, R. H., C.H. Cheng, and J.A. Meredith, Evaluation and prediction of shear wave velocities in calcareous marine sediment and rocks, J. Geophys. Res., 97, 9297-9305, 1992.
Willis, M.E., and M.N. Toksöz, Automatic P and S velocity determination from full waveform digital acoustic logs, Geophysics, 48, 1631-1644, 1983.
Wood, W.T., P.L. Stoffa, and T.H. Shipley, Quantitative detection of methane hydrate through high-resolution seismic velocity analysis, J. Geophys. Res., 99, 9681-9695, 1994.
Wood, A.B., A textbook of sound, G. Bell and Sons, Ltd, London, 1941.
Zastepina, O.Y., and B.A. Buffett, Phase equilibrium of gas hydrate: implications for the formation of hydrates in the deep sea floor, Geophys. Res. Lett., 24(13), 1667-1570, 1997.
Zimmerman, R.W., and M.S. King, The effect of the
extent of freezing on seismic velocities in unconsolidated permafrost,
Geophysics,
51, 1285-1290, 1986.
Table 1: Linear fit as a
function
of depth (z) for data in Figs. 3 and 6a
The regression coefficient (R)
is given in brackets.
|
|
|
|
|
|
|
|
|
|
|
|
|
|
|
|
||
|
|
|
|
|
|
|
|
|
|||
Table 2: Elastic parameters used in elastic models
|
|
|
|
|
|
|
|
|
|
|
|
|
|
|
|
|
|
|
|
|
|
|
|
|
|
|
|
|
|
|
|
|
|
|
|
|
|
|
|
|
|
![]()