Acoustic and Thermal Characterization
of Oil Migration, Gas Hydrates Formation and Silica Diagenesis
ABSTRACT
Acoustic and Thermal Characterization
of Oil Migration, Gas Hydrates Formation and Silica Diagenesis
ABSTRACT
This dissertation presents four processes occurring in marine sediments with distinct signatures in standard geophysical datasets. The diagenetic transformation of Opal-A to Opal-CT, the formation of gas hydrates, fluid substitution in hydrocarbon reservoirs, and fluid migrations in a fault are described with a common approach: identify the specificity of each process and reproduce their `distinct' signature to quantify how it affects the sediments.
In Chapter 1 we describe the changes occurring when dissolved Opal-A re-precipitates into Opal-CT in siliceous sediments. This diagenetic transformation produces regional Bottom Simulating Reflectors (BSRs) in seismic surveys. We use geophysical logs to calculate the elastic moduli of sediments through a BSR offshore New Jersey. Comparison with classic consolidation models shows that the mechanical changes are controlled by a decrease in porosity following the "Gassmann" formulation.
A more common BSR is associated with the occurrence of gas hydrates and underlying free gas. In Chapter 2, logging results from the Blake Ridge show that classic models cannot describe elastic properties of hydrated sediments. The cementation theory describing interactions between grains uniformly coated by hydrates reproduces best the observations. According to this model, Gas hydrates occupy about 10% of the pore space above the BSR and coexist with free gas below.
In Chapter 3, we use various elastic models to interpret changes observed between successive 3D seismic surveys of producing reservoirs. The models are applied to the results of reservoir simulation to translate seismic impedance differences into fluid substitution and bypassed hydrocarbon. This time-lapse methodology is applied to two reservoirs in the Gulf of Mexico.
In the last chapter, we present the thermal regime in the Eugene Island 330 oil field, within an active fault. The temperature distribution reconstructed from 600 Bottom Hole Temperatures displays ~10° C anomalies overlying salt diapirs and the fault. 3D numerical modeling of heat transfers is used to estimate the contributions of the diapirs and of fluid migrations along the fault. Some of the observed anomalies could result from 5,000 years-long fluid circulations.
Note: If you are interested by the material covered in this thesis, I would be happy to receive your feedback regarding any of the chapters. Thanks in advance.
Any reference should be made as "Guerin, Gilles 2000. Acoustic and Thermal Characterization of Oil Migration, Gas Hydrates Formation and Silica Diagenesis, PhD. Thesis, Columbia University"
CONTENTS
Acknowledgements and Dedication
Chapter 1: Acoustic and elastic properties of calcareous sediments across a siliceous diagenetic front on the eastern U.S. continental slope
1.1 Abstract
1.2 Introduction
1.3 Logging Results
1.4 Velocity-Porosity Models
1.4.1 Models description
1.4.2 Hole 902D
1.5 Elastic Moduli and Porosity
1.6 Discussion
1.7 Conclusion
References
Tables
Chapter 2: Characterization of in situ elastic properties of gas hydrate-bearing sediments on the Blake Ridge
2.1 Abstract
2.2 Introduction
2.3 Logging data
2.3.1 Sonic logging
2.3.2 Data Interpretation
2.3.3 Porosity correction and gas hydrate saturation from the resistivity log
2.4 Elastic Moduli of Hydrate-bearing sediments
2.5 Methane Saturation from elastic moduli
2.6 Determination of the free gas concentration
2.7 Discussion
2.7.1 Quality of the logging data
2.7.2 Comparison of the Models
2.7.3 Coexistence of hydrates and free gas from logs at Site 995
2.7.4 Mechanisms for coexistence of hydrates and free gas
2.7.5 Comparison between Sites 994, 995 and 997
2.8 Conclusions
References
Tables
Chapter 3: Simulation of production and elastic properties of reservoirs to validate time-lapse seismics.
3.1 Introduction
3.2 The 4D seismic loop
3.2.1 Registration and normalization of seismic datasets
3.2.2 Non linear inversion of successive 3D datasets
3.2.3 Preliminary 4D interpretation of the K8 sand
3.3 Elastic properties of reservoir sediments
3.3.1 Elastic models
3.3.1.1 Theoretical formulations
3.3.1.2 Experimental relationships
3.3.2 Fluid properties
3.3.2.1 Properties of fluid mixtures
3.3.2.2 Elastic properties of reservoir fluids
3.3.2.3 Original fluids in place
3.3.3 Stochastic reservoir characterization
3.3.4 From saturation to impedance
3.3.5 Comparison with vertical sweep
3.4 Reservoir Simulation
3.4.1 Permeability distribution
3.4.2 Multiple-phase fluid flows in porous media
3.4.3 Simulator description
3.4.4 Simulation of K8
3.4.4.1 Constraint on the simulation: production history analysis
3.4.4.2 Simulation results
3.4.4.2.1 History match
3.4.4.2.2 Fluid saturations and impedance
3.5 LF sand, Eugene Island 330
3.5.1 Geological setting and history
3.5.2 Preliminary 4-D impedance analysis
3.5.3 Reservoir characterization of LF330
3.5.4 Fluid properties and initial conditions
3.5.5 Simulation results
3.6 Discussion - End of the 4D loop
3.6.1 Discussion of the LF sand results
3.6.2 Closing the 4D analysis loop - optimization
3.7 Conclusions
References
Tables
Appendix: Reservoir fluid properties
Chapter 4: 3D Temperature distribution and numerical modeling of heat transfers in an active fault zone: Eugene Island 330, Offshore Louisiana.
4.1 Abstract
4.2 Introduction
4.3 Geological Setting
4.4 The Temperature distribution in Eugene Island 330
4.4.1 Data Correction
4.4.2 Heat transfer in sedimentary basins
4.4.3 Heat sources
4.4.3.1 Radiogenic heat
4.4.3.2 Heat generation from oil maturation
4.4.4 The effect of sedimentation
4.4.5 Analysis of the present-day temperature distribution
4.4.6 One dimensional analysis of heat advection
4.5 Numerical modeling of the conductive regime
4.5.1 Model description
4.5.2 Results
4.6 Numerical simulation of fluid migration
4.6.1 Indications for fluid circulation within the Red Fault
4.6.2 3D Numerical simulation of the pressure and temperature
4.6.2.1 Numerical formulation
4.6.2.2 Properties at the interface
4.6.2.3 Sources
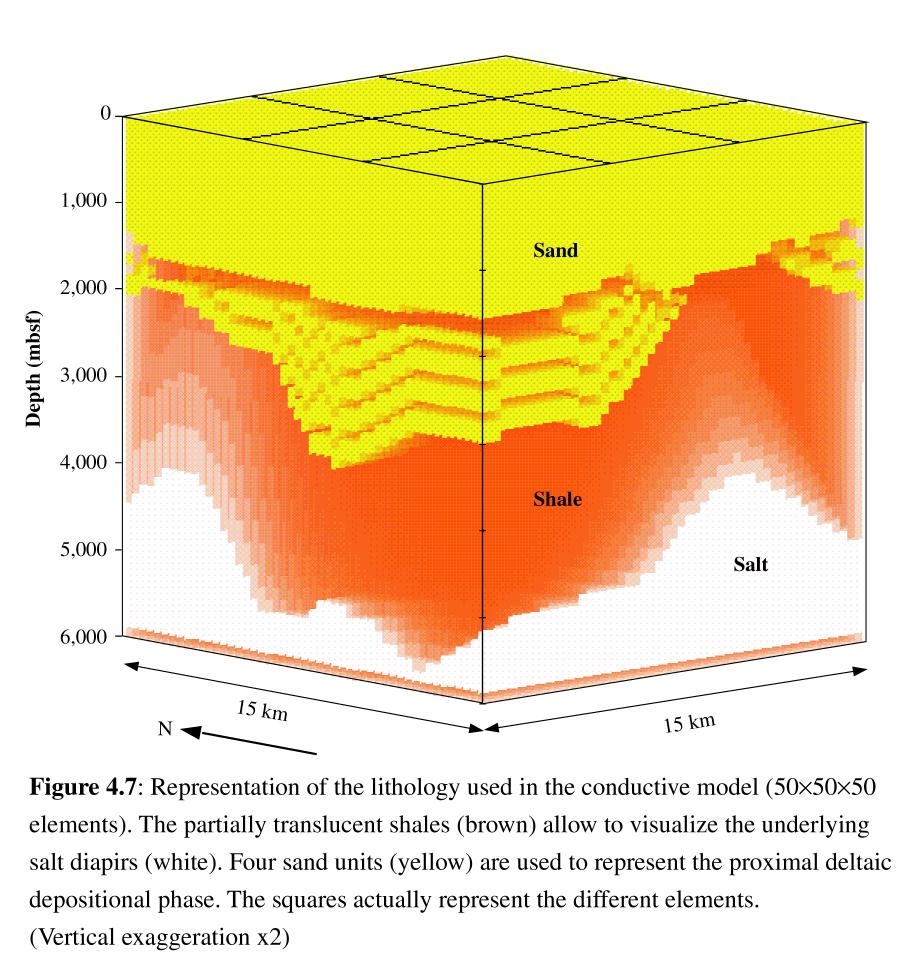
4.6.2.4 Lithology description
4.6.2.5 Numerical controls
4.6.2.6 Fault simulation
4.6.3 Results
4.6.4 Discussion
4.6.5 Limitations of the results
4.7 Conclusion
References
Tables
Figures
Preliminary Figure:Overview of the manifestation of the processes described in this dissertation .
Chapter 1: Acoustic and elastic properties of calcareous sediments across a siliceous diagenetic front on the eastern U.S. continental slope
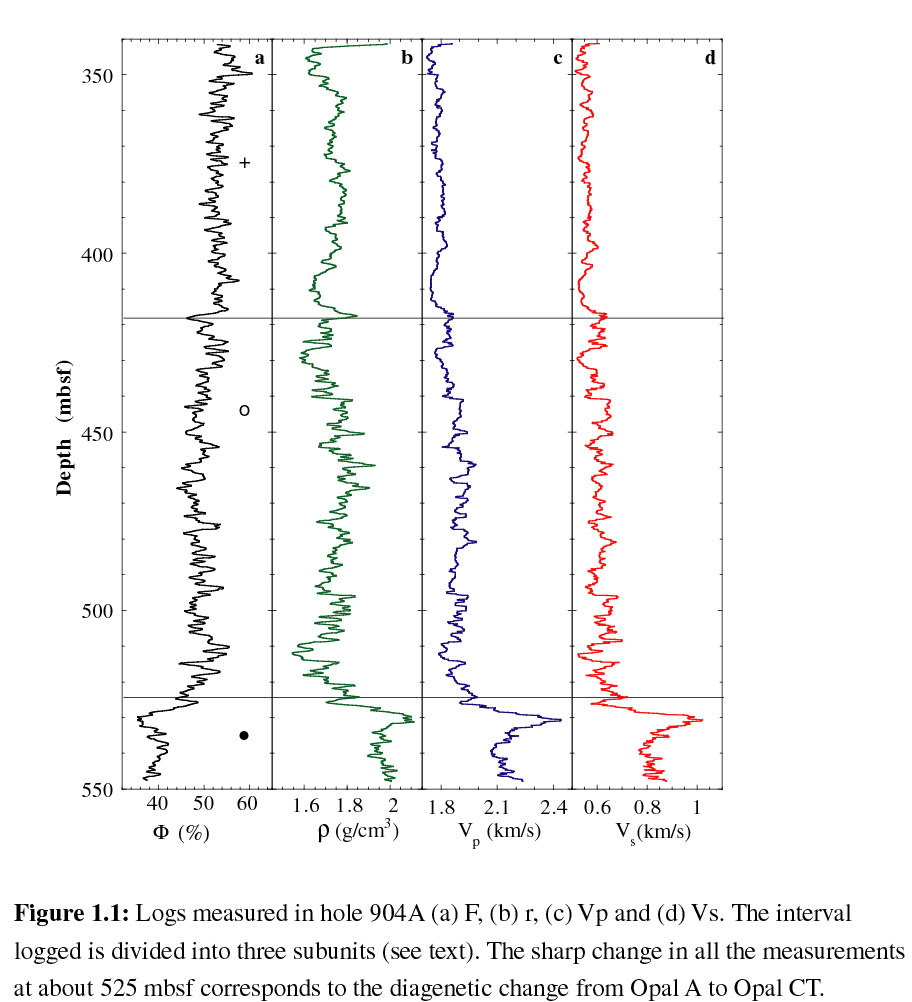
Figure 1.1.Logs measured in Hole 904A, ODP Leg 150.
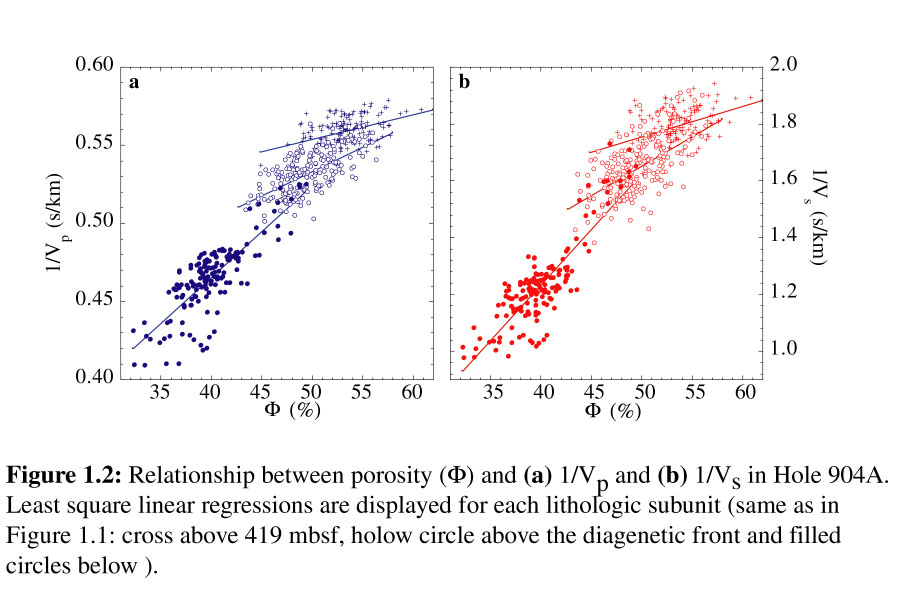
Figure 1.2. Relationship between ? and (a) 1/Vp and (b) 1/Vs in Hole 904A.
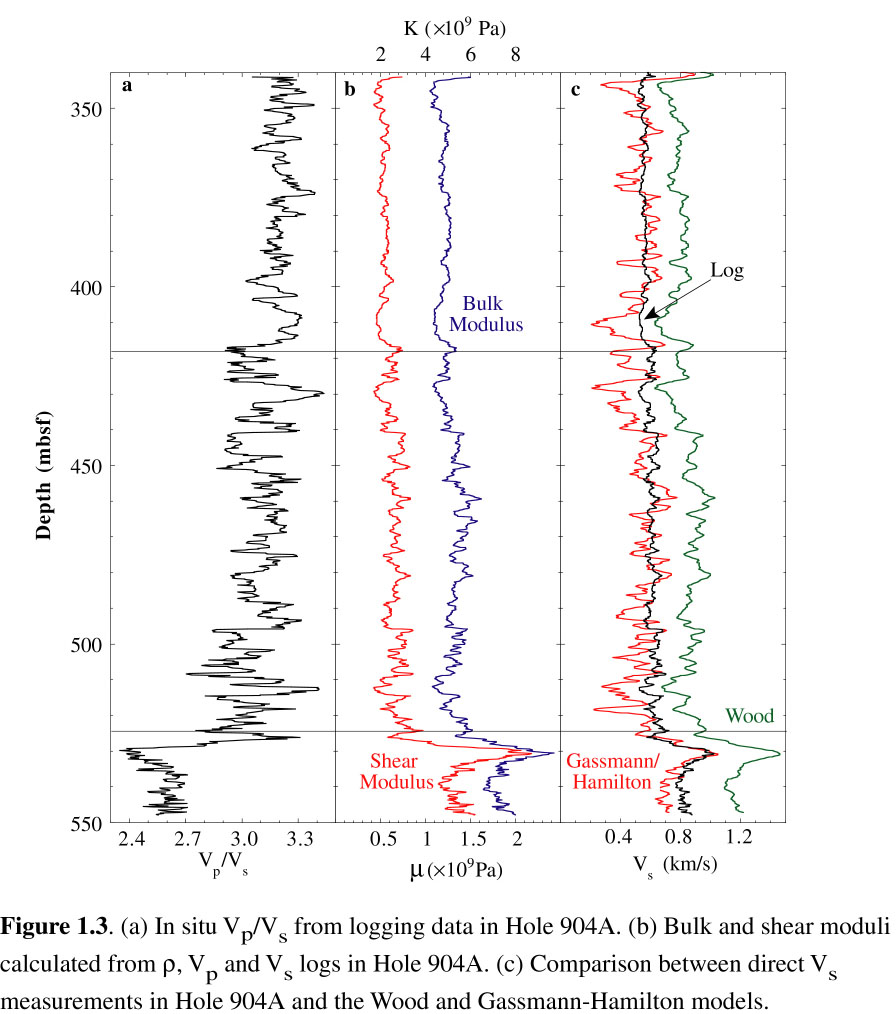
Figure 1.3. Elastic moduli calculated from logs in Hole 904A.
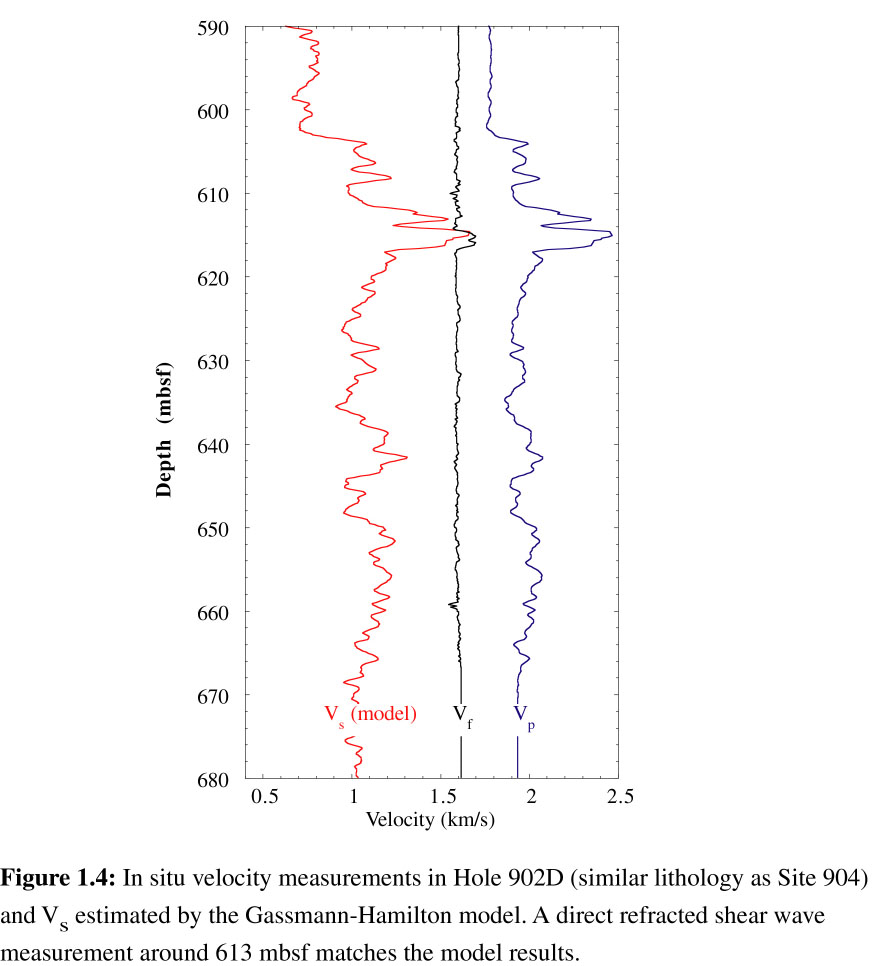
Figure 1.4. In situ velocity measurements in Hole 902D.
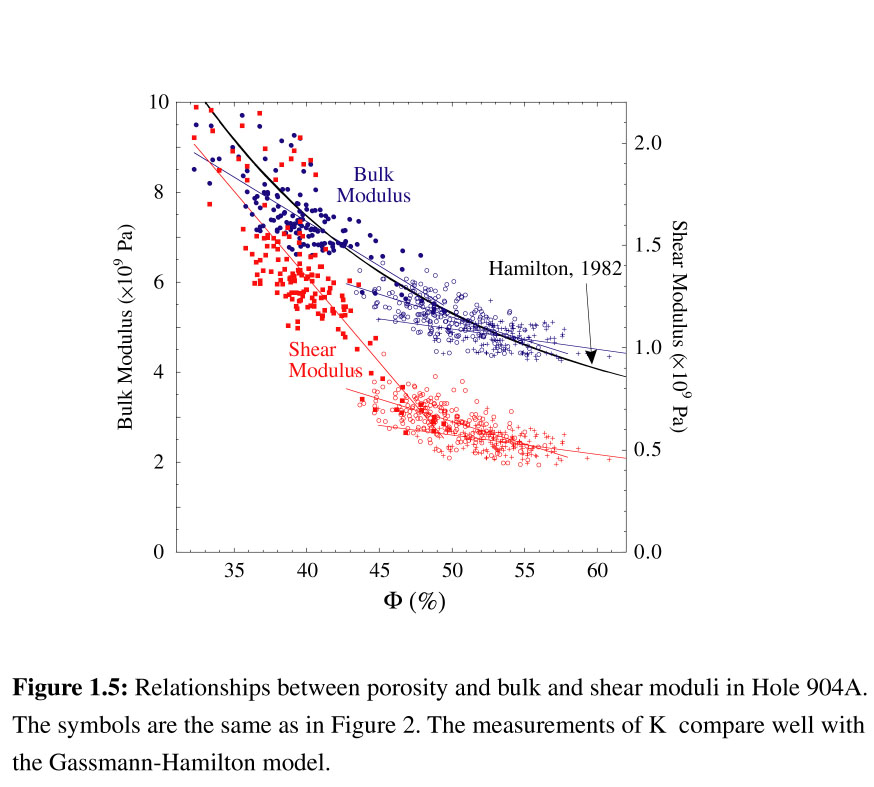
Figure 1.5. Relationships between ? and K and ??in Hole 904A.
Chapter 2: Characterization of in situ elastic properties of gas hydrate-bearing sediments on the Blake Ridge
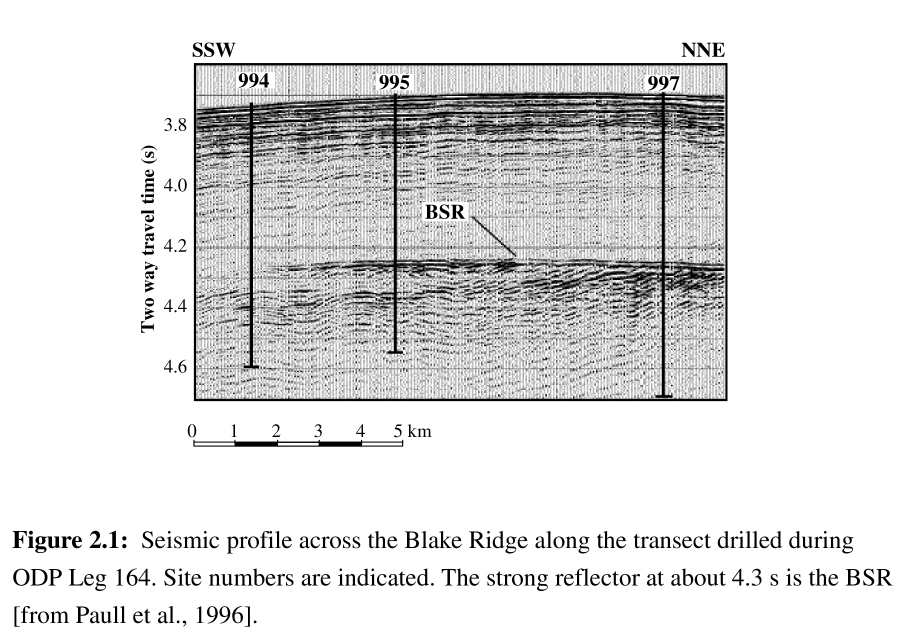
Figure 2.1: Seismic profile across the Blake Ridge along the transect of ODP Leg 164.
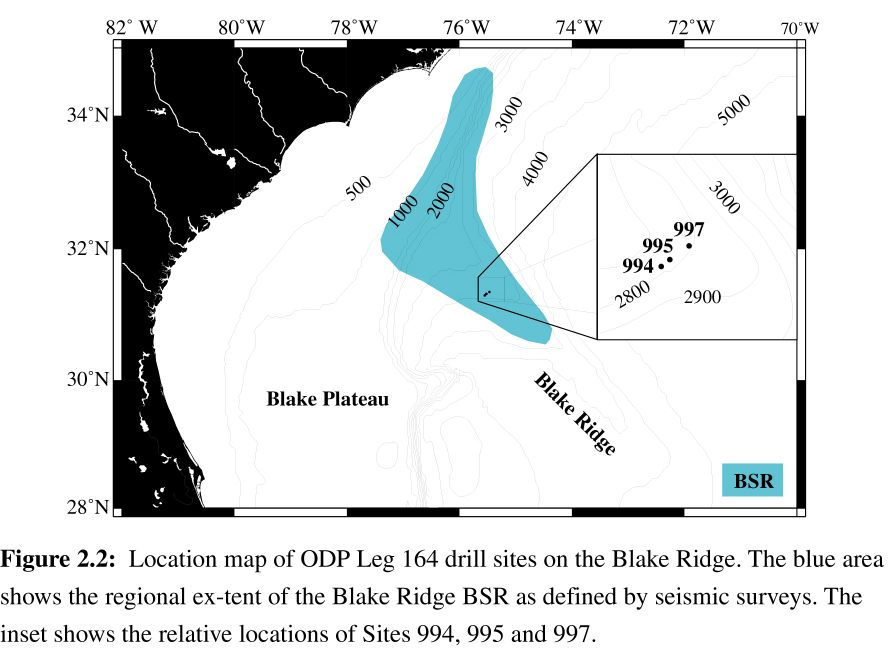
Figure 2.2: Location map of ODP Leg 164 and regional BSR.
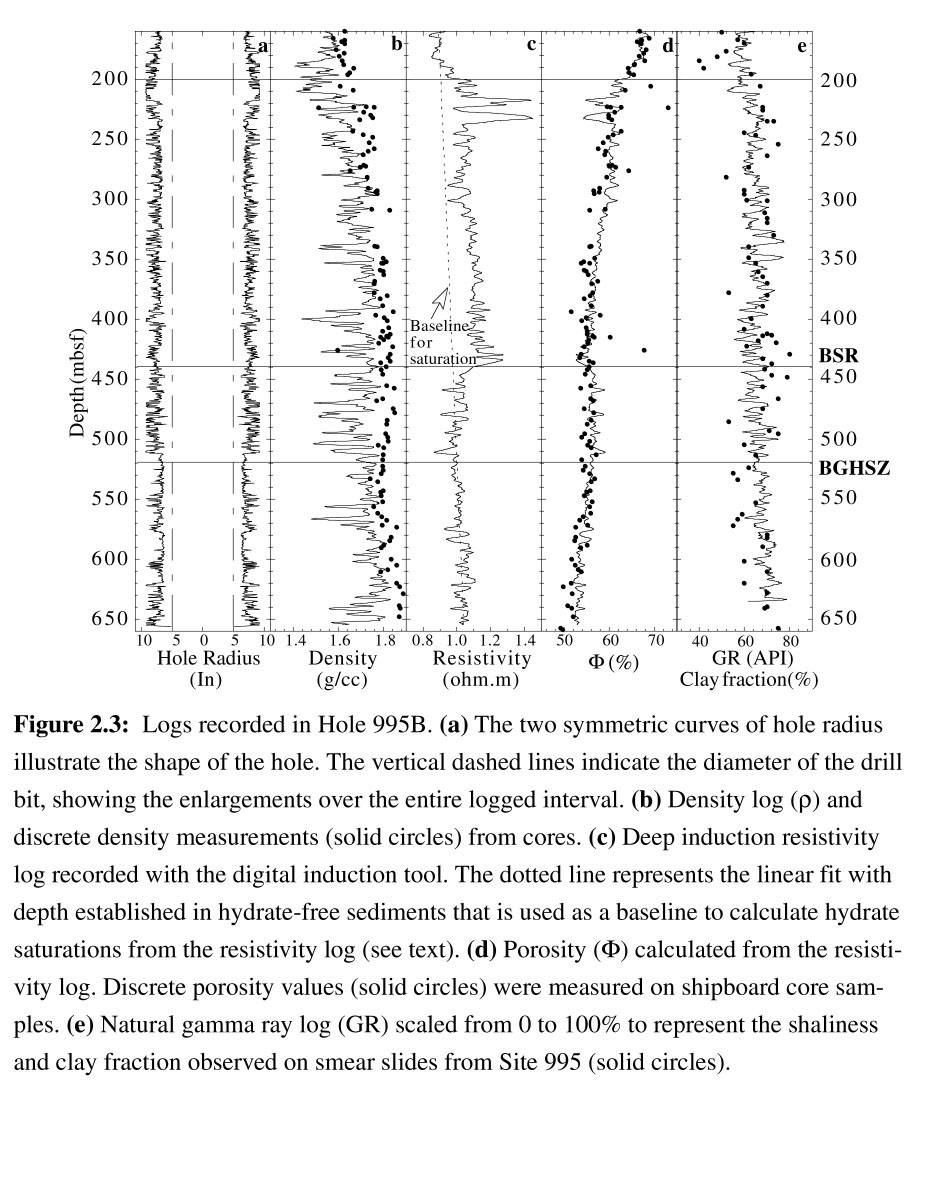
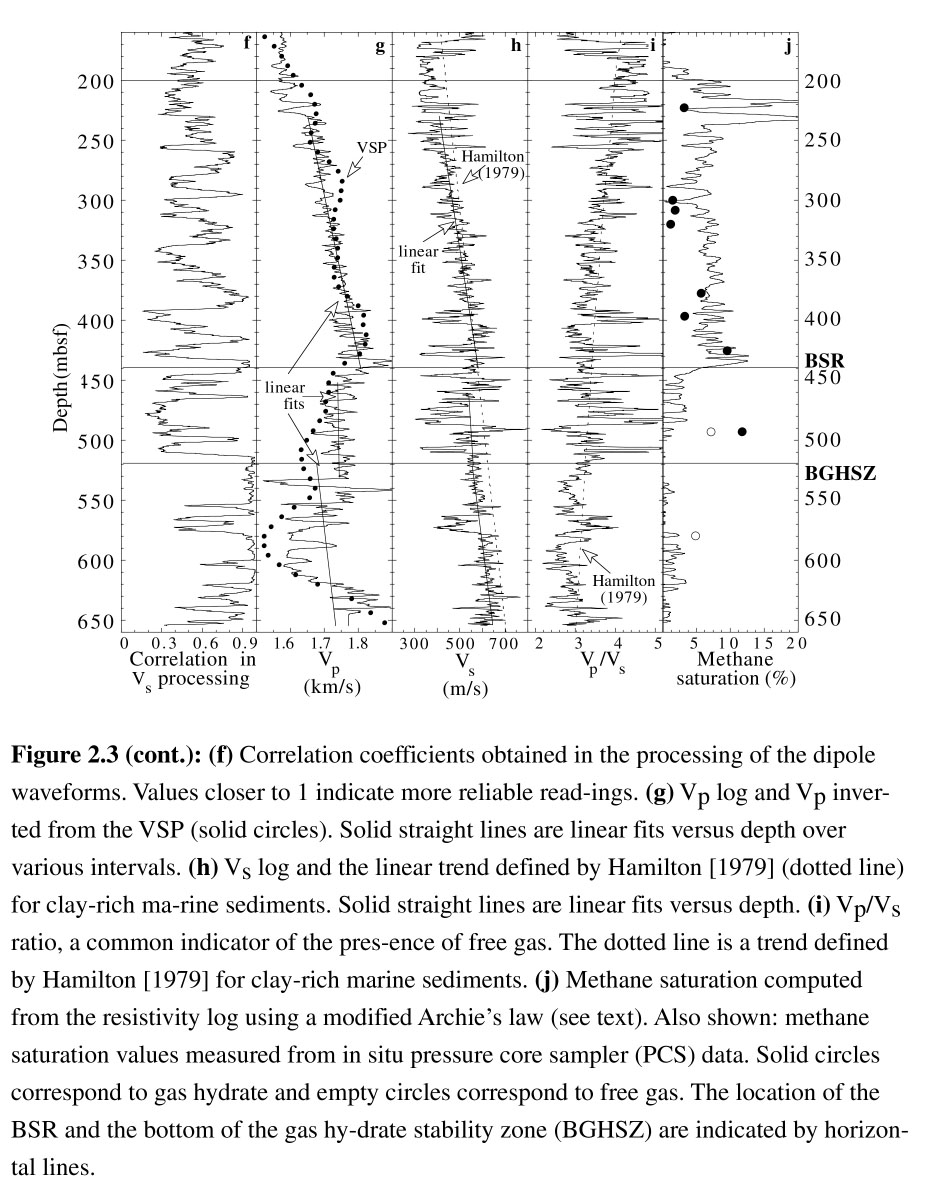
Figure 2.3: Logs recorded in Hole 995B (part 1, part 2)
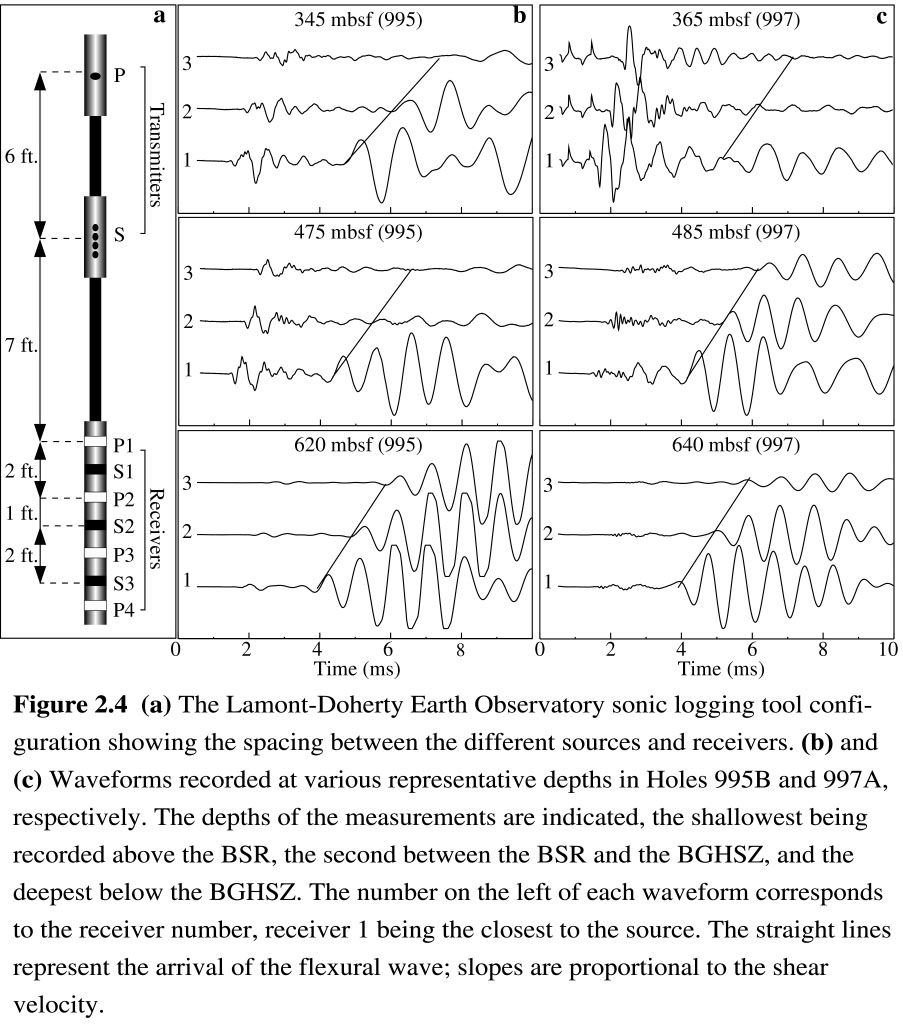
Figure 2.4: Shear sonic logging tool configuration and typical waveforms in Holes 995B and 997A.
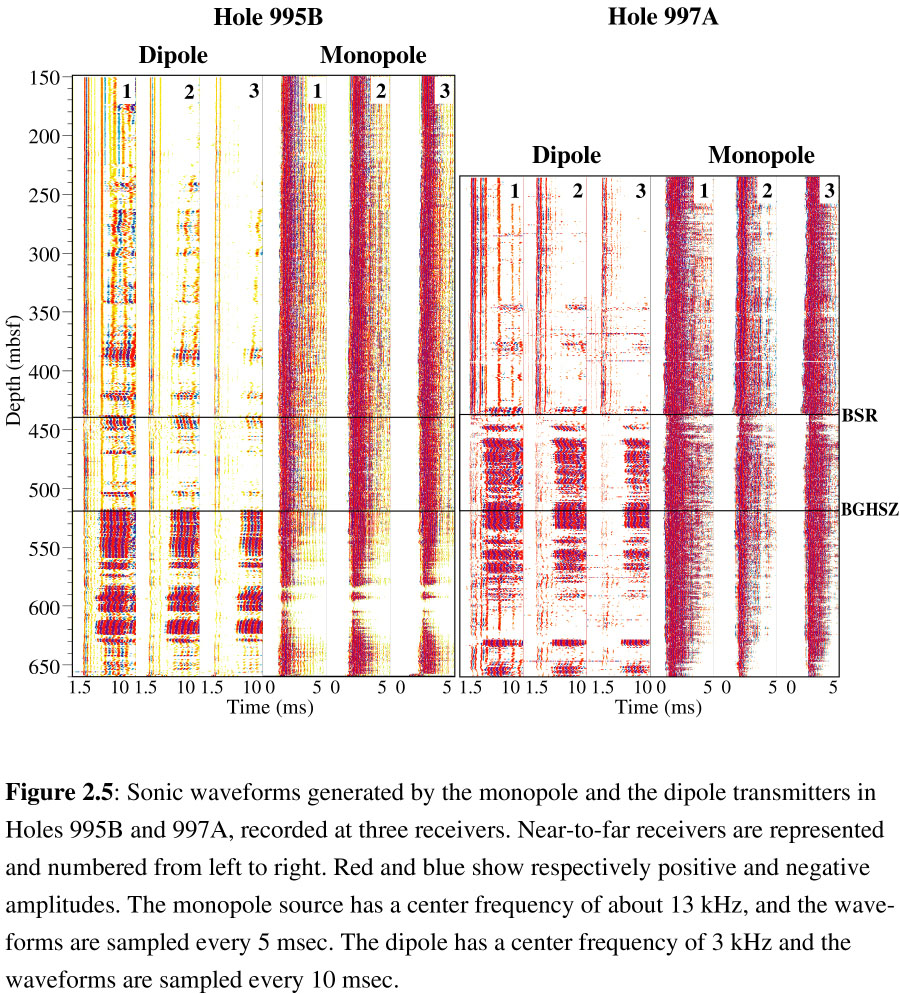
Figure 2.5: Sonic waveforms recorded in Holes 995A and 997B.
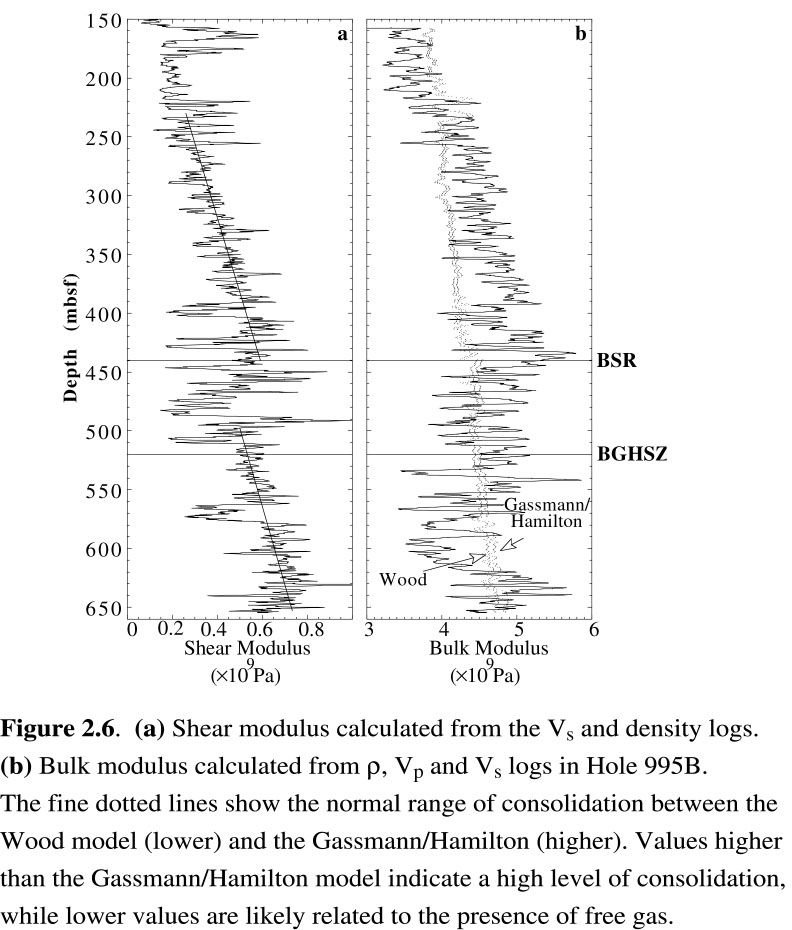
Figure 2.6: Elastic moduli calculated from logs in Hole 995A.
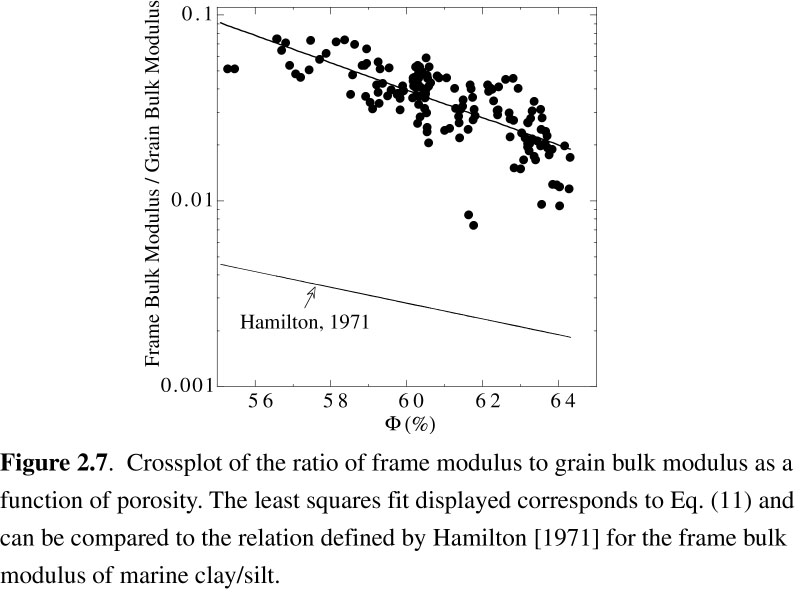
Figure 2.7: Relationship between frame modulus and porosity in Hole 995A.
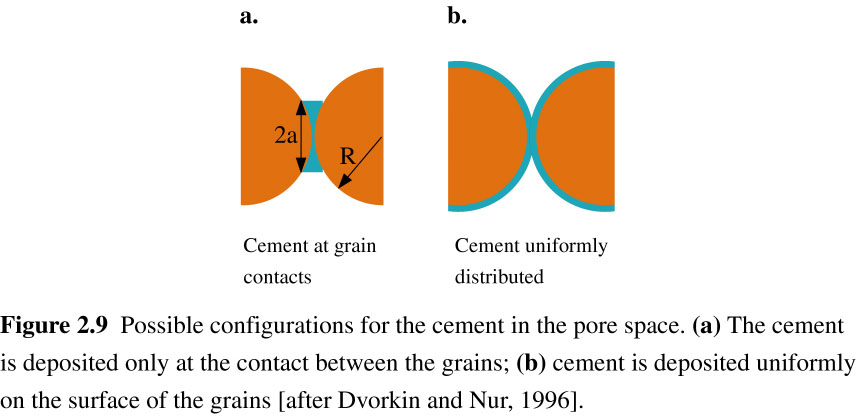
Figure 2.8: Cement and grain configurations in the cementation theory.
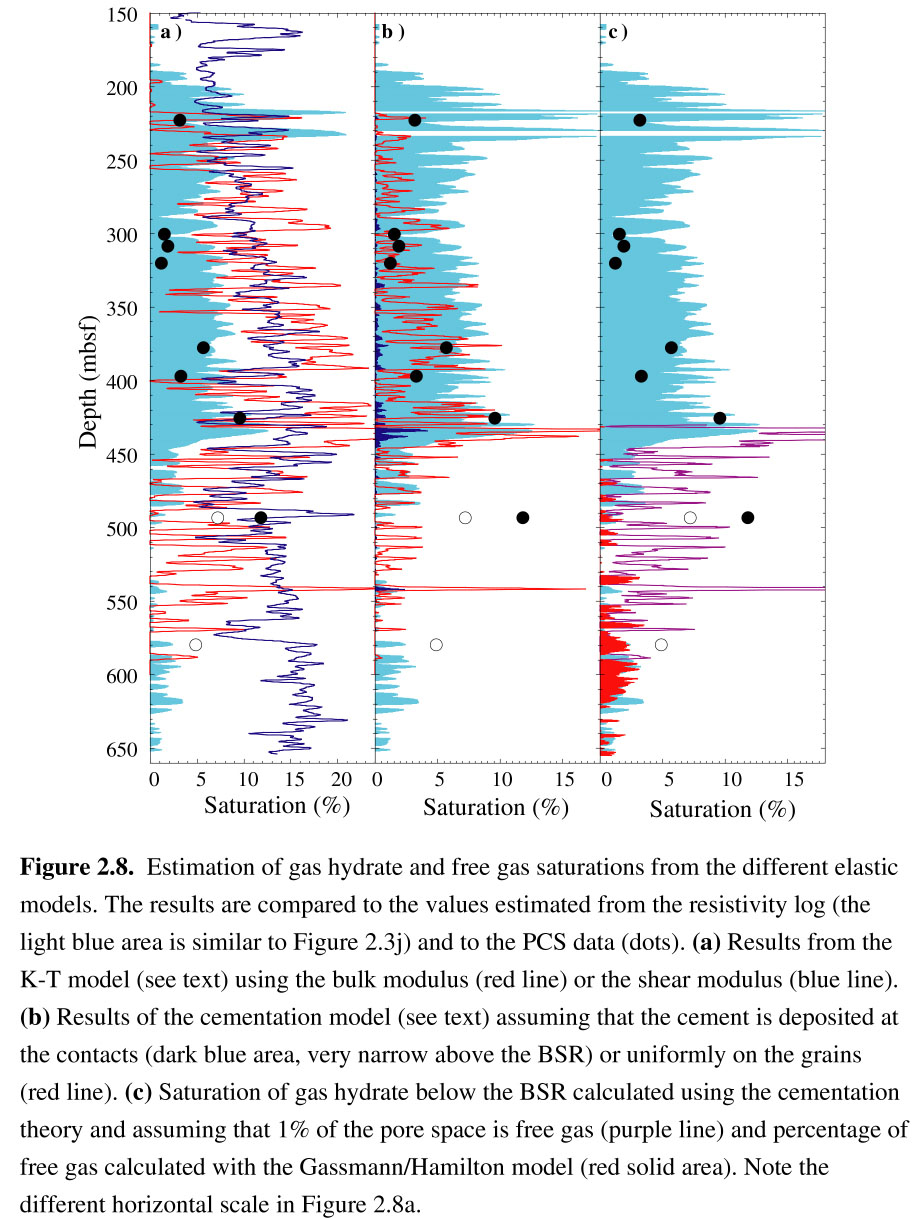
Figure 2.9: Estimation of gas hydrate and free gas saturations in Hole 995A from the different elastic models.
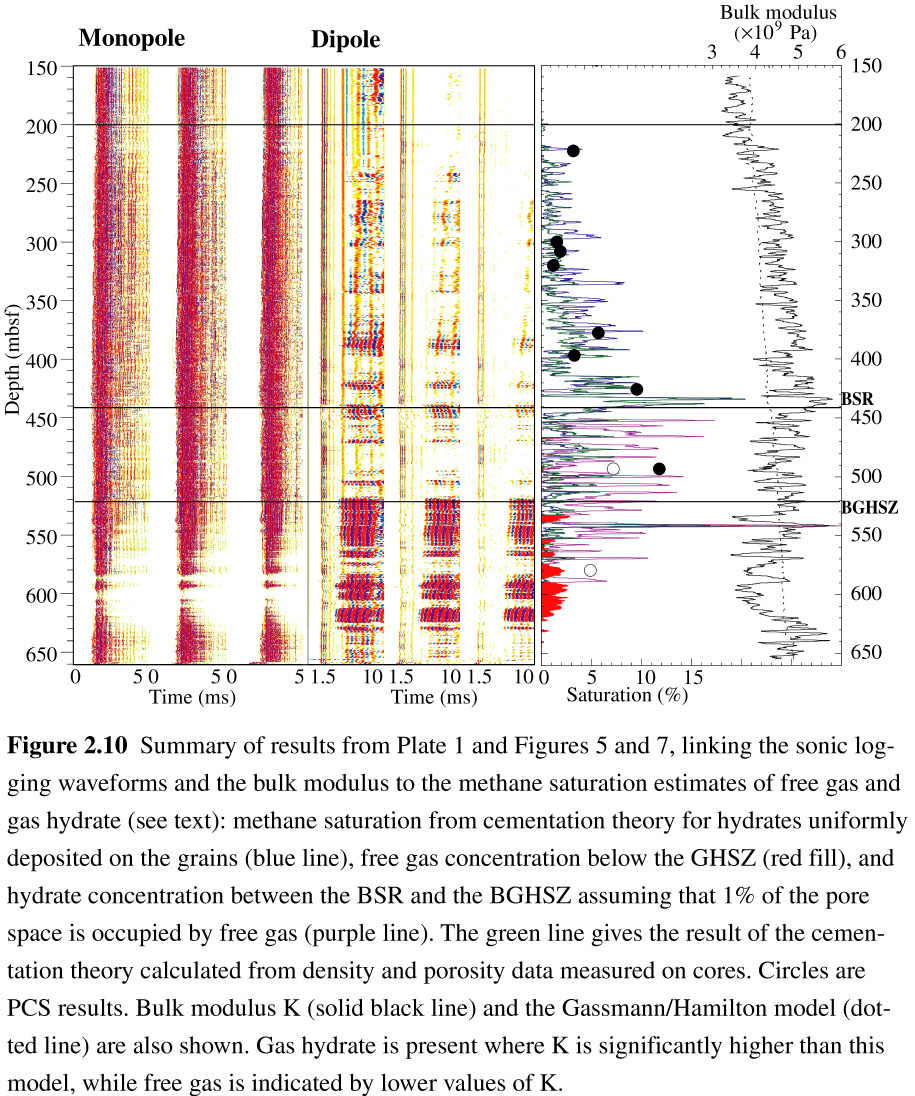
Figure 2.10: Summary of logs and methane concentrations in Hole 995A.
Chapter 3: Simulation of production and elastic properties of reservoirs to validate time-lapse seismics.
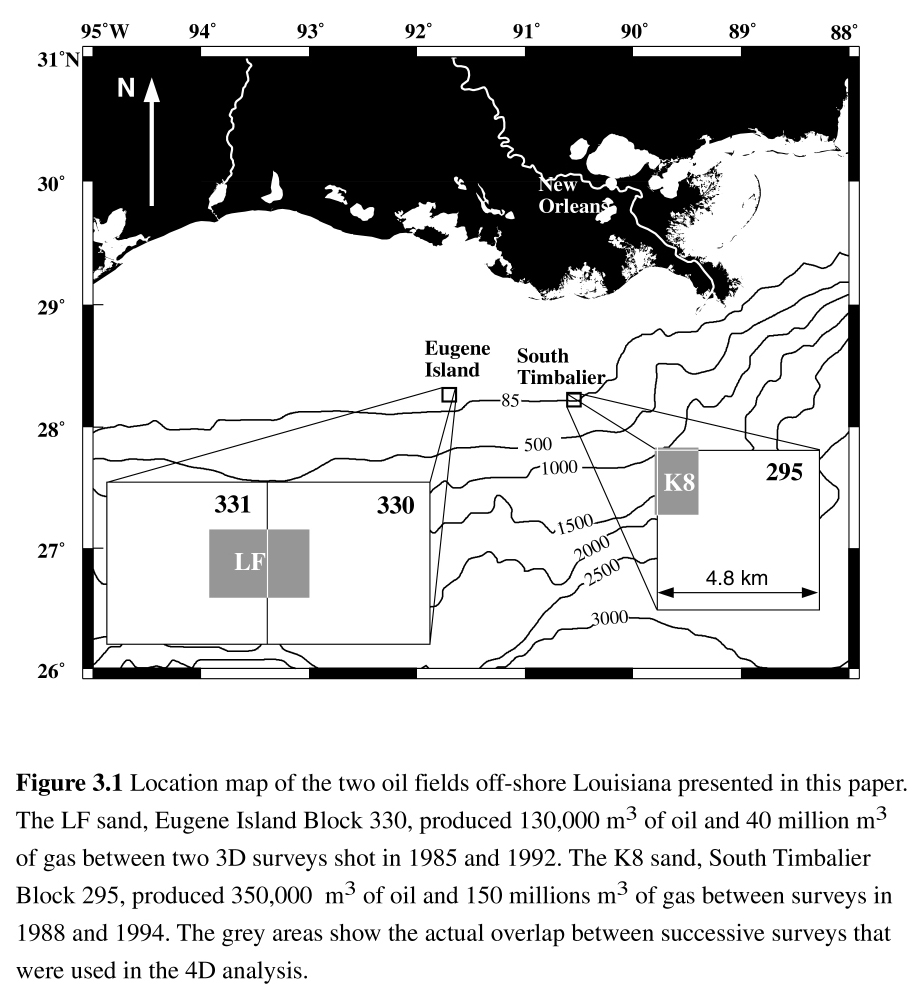
Figure 3.1: Location map of the ST295 and EI330 oil fields, Offshore Louisiana.
Figure 3.2: Structure of the K8 reservoir, South Timbalier 295.
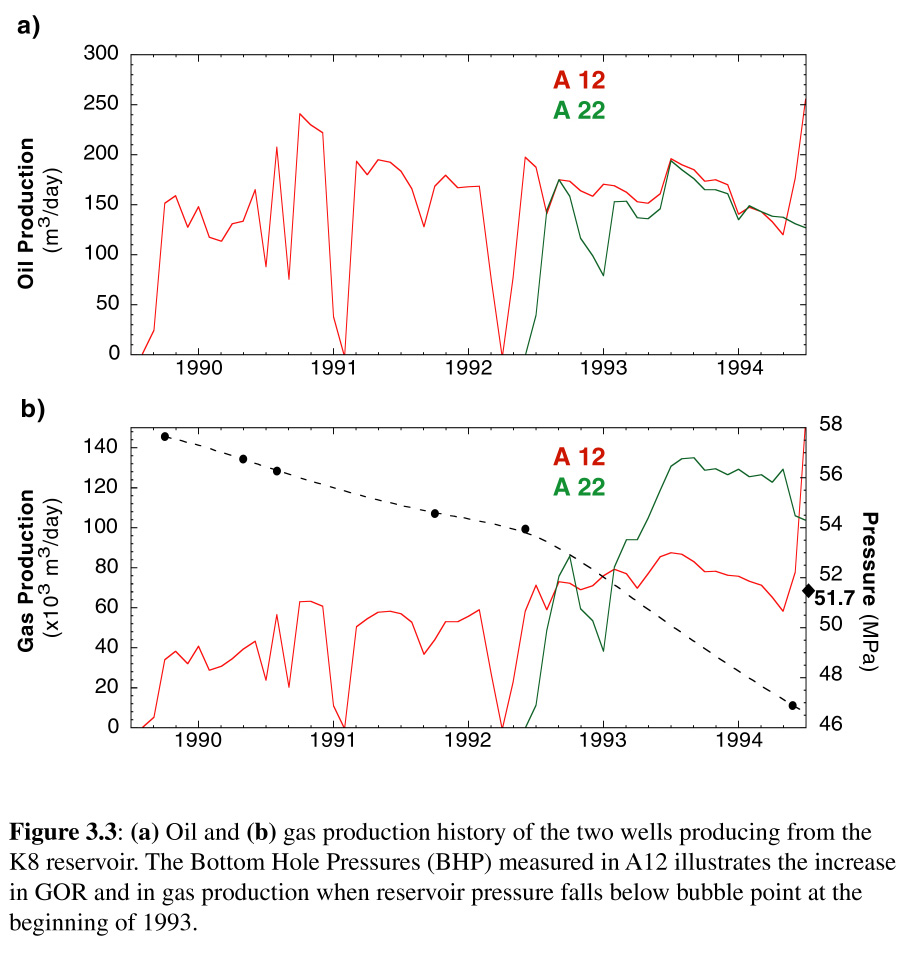
Figure 3.3: Production history of K8.
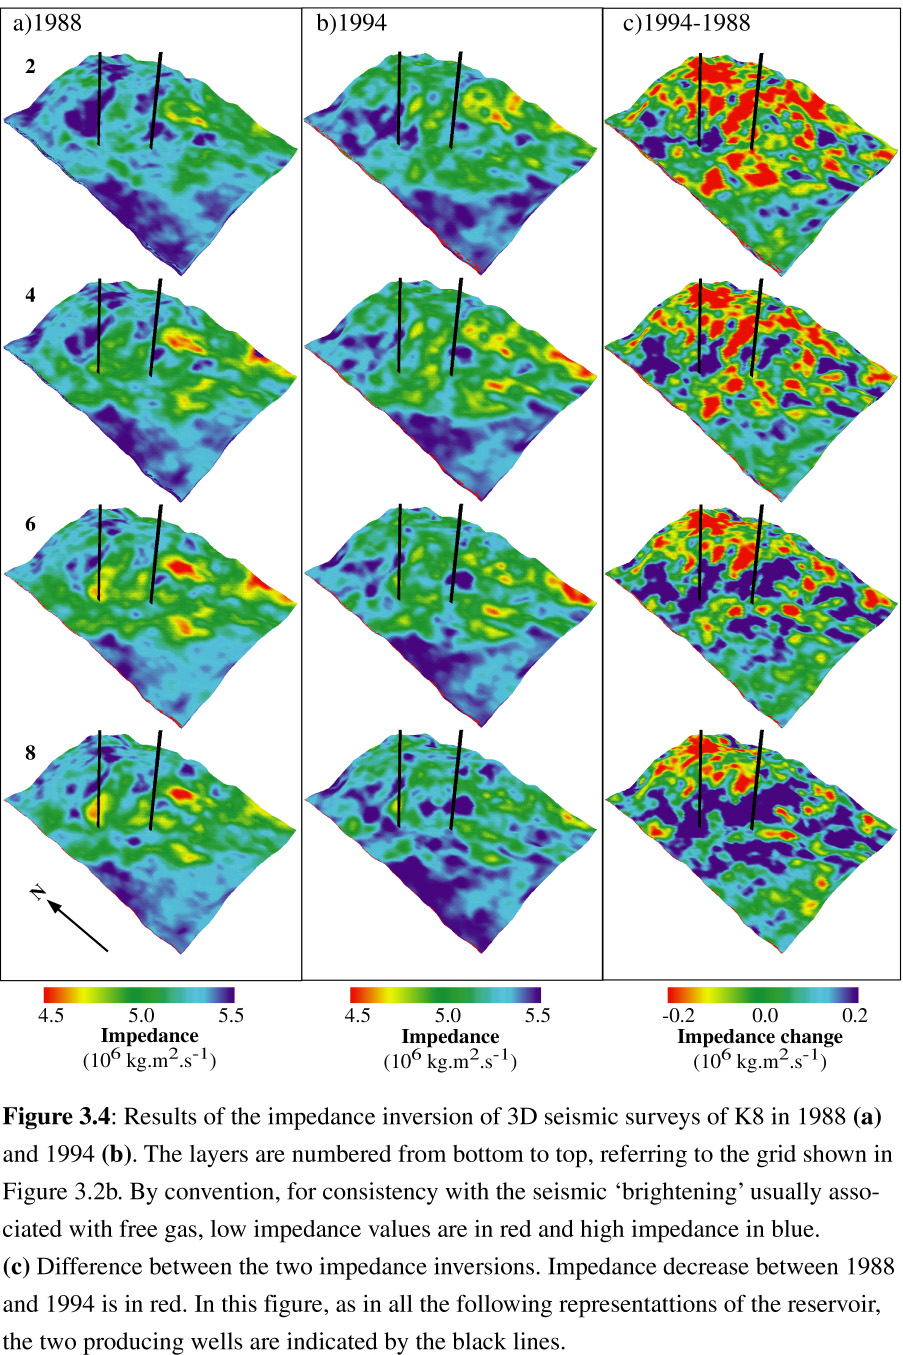
Figure 3.4: Impedance inversion results for K8 in 1988 and 1994.
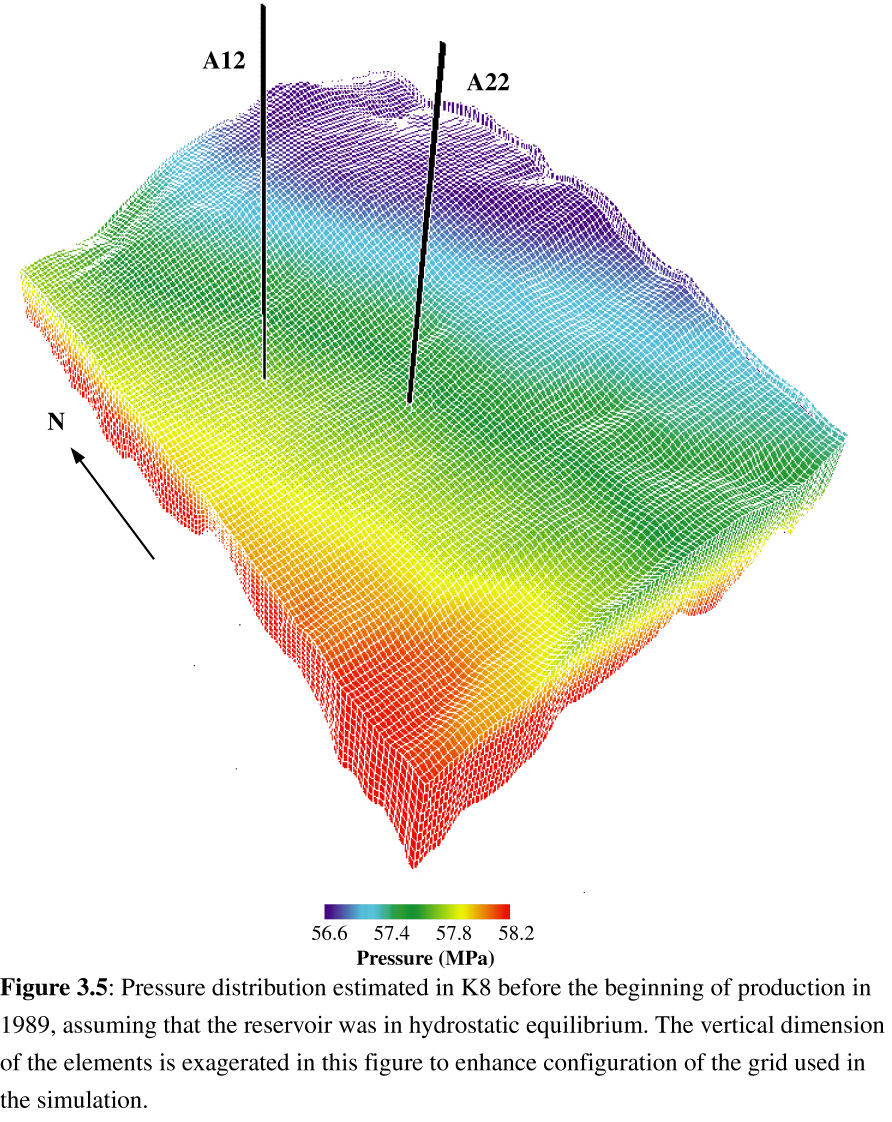
Figure 3.5: Initial pressure distribution and simulator grid in K8.
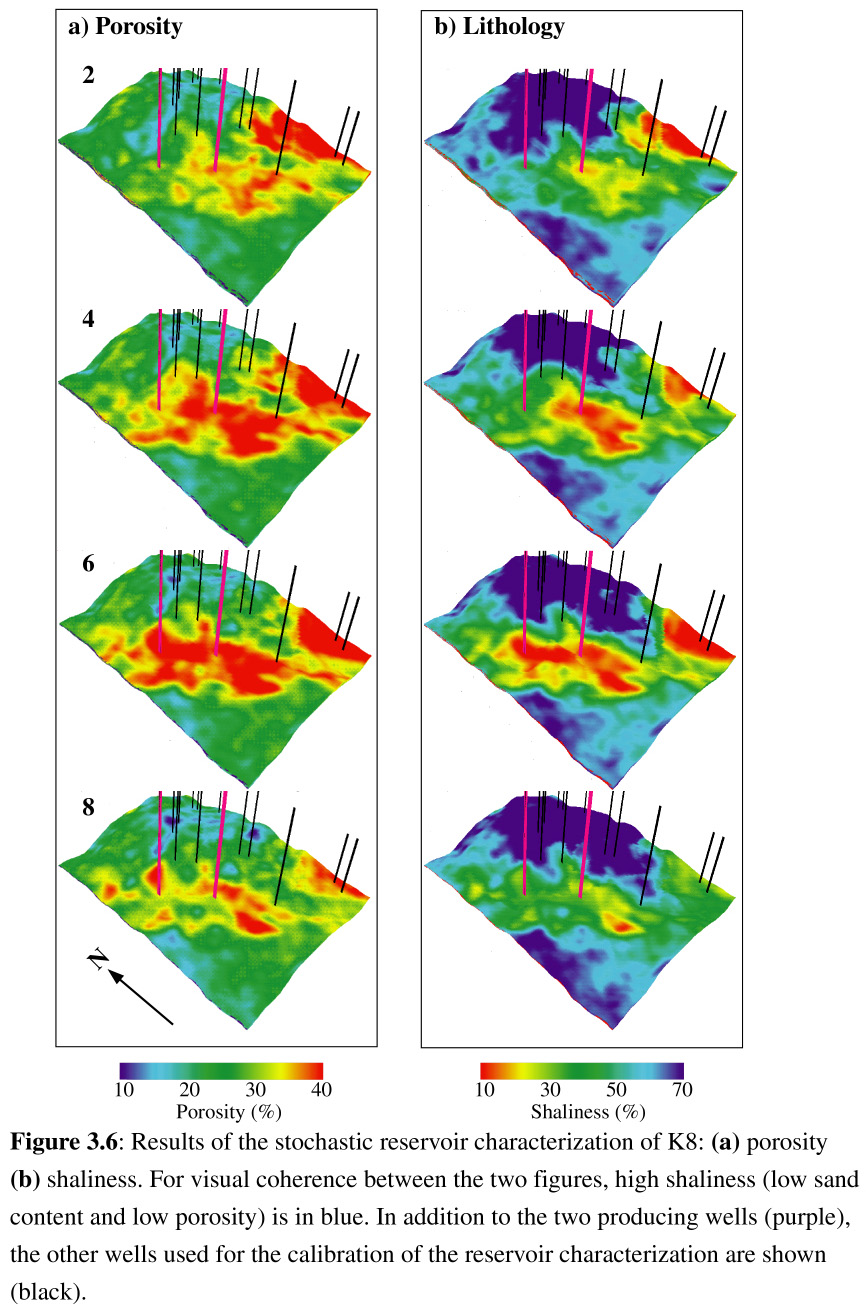
Figure 3.6: Stochastic reservoir characterization of K8.
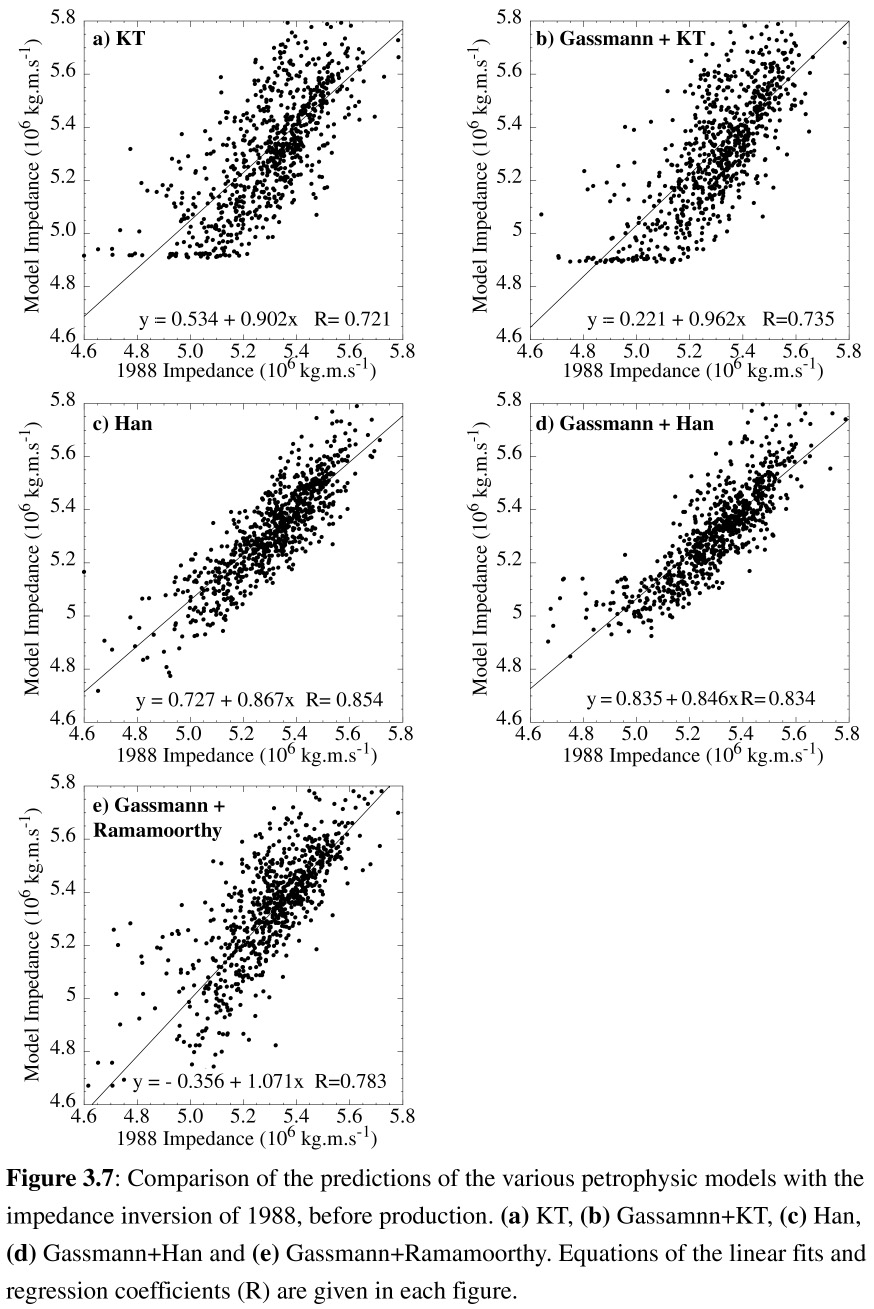
Figure 3.7: Comparison of the petrophysic models with the 1988 impedance inversion.
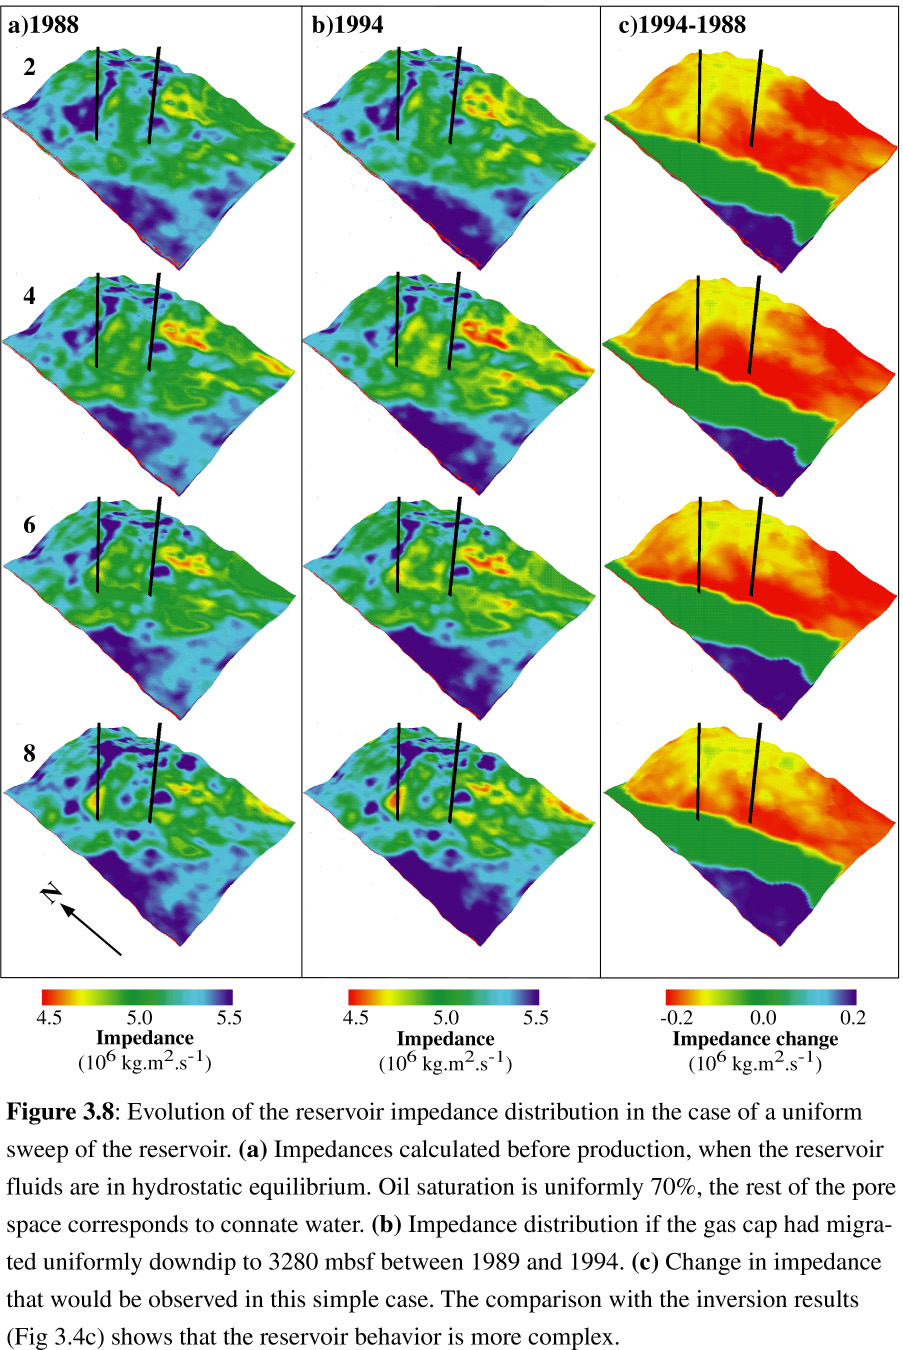
Figure 3.8: Evolution of the reservoir impedance in the case of a uniform sweep.
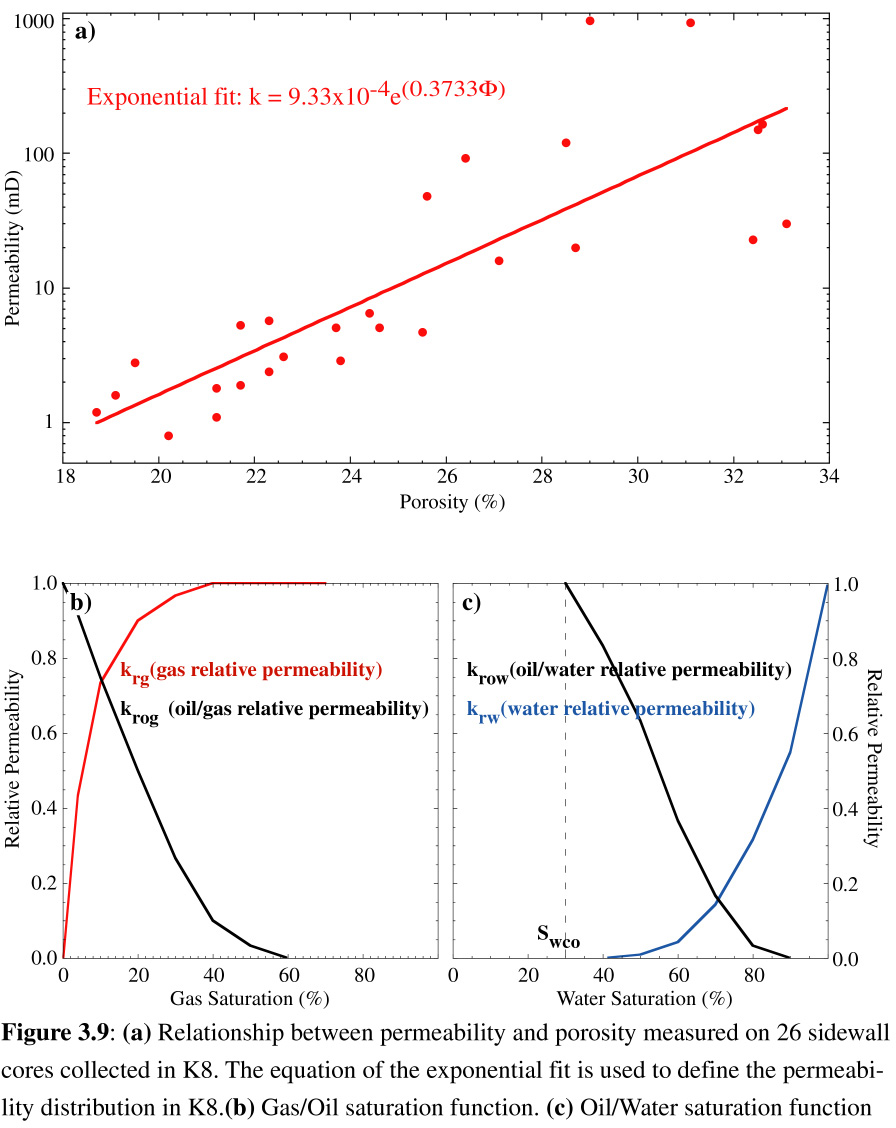
Figure 3.9: Permeability/porosity relationship from K8 core samples.
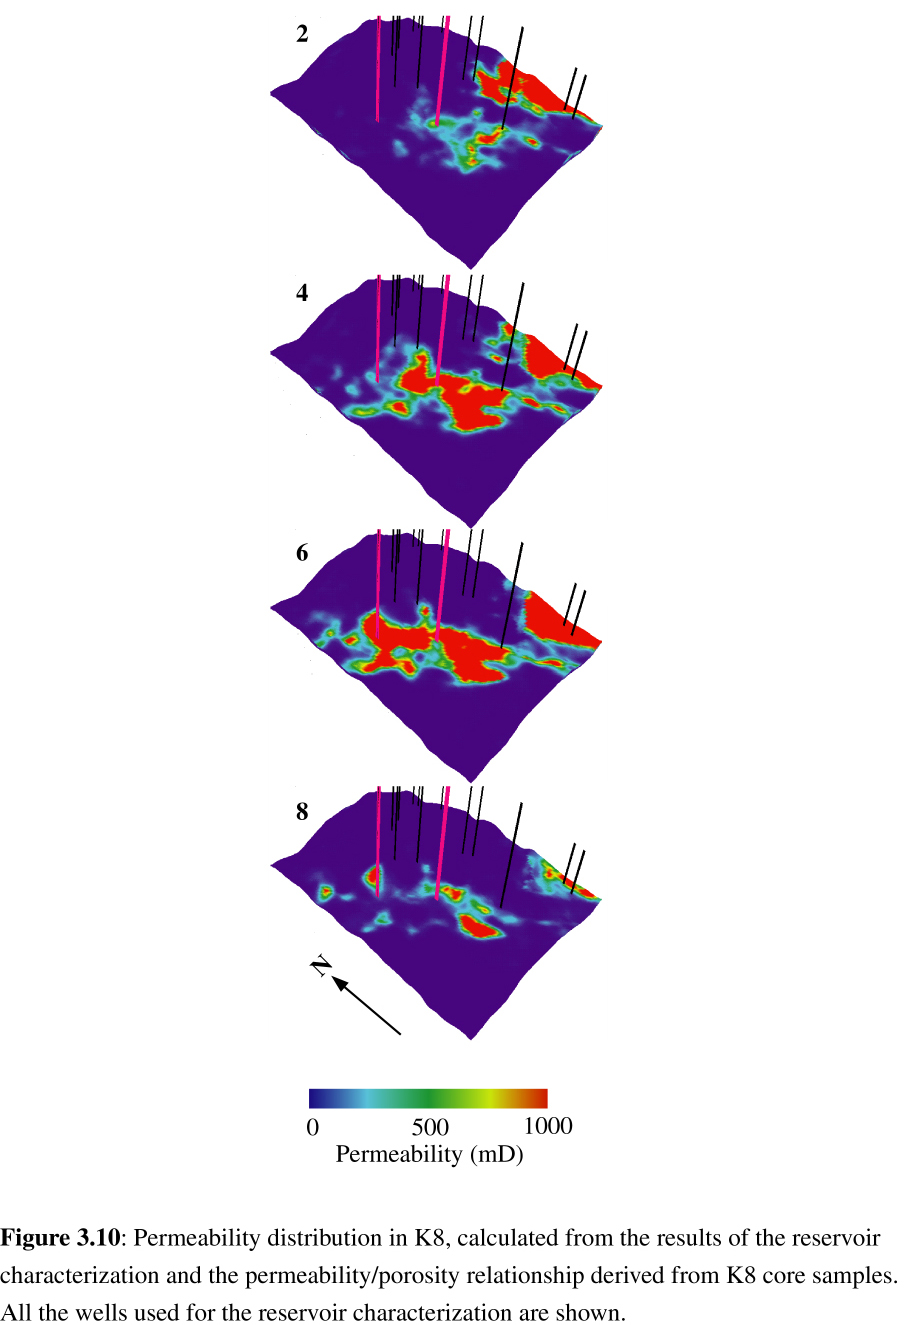
Figure 3.10: Permeability distribution in K8.
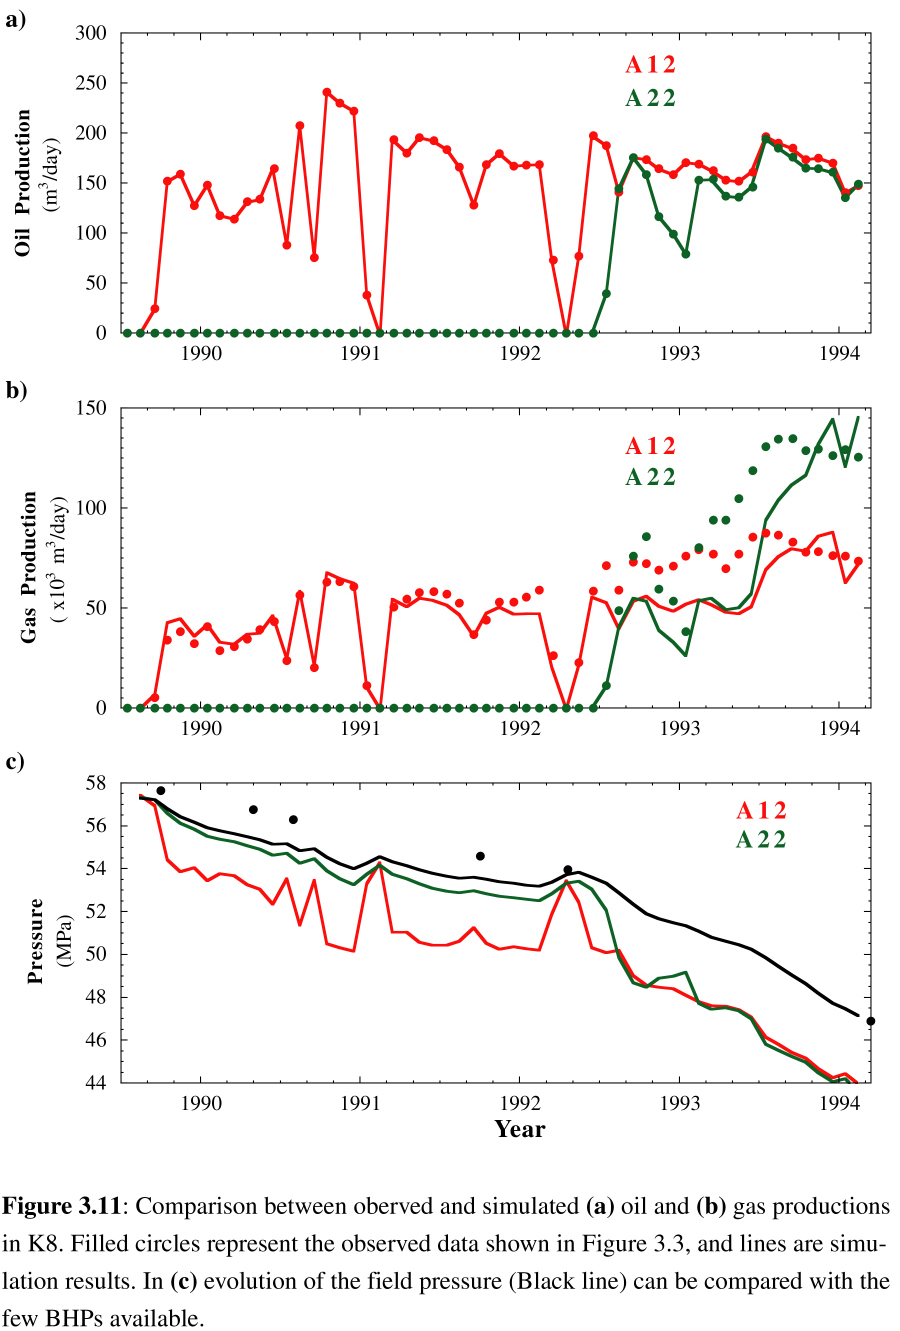
Figure 3.11: Simulated production history match in K8.
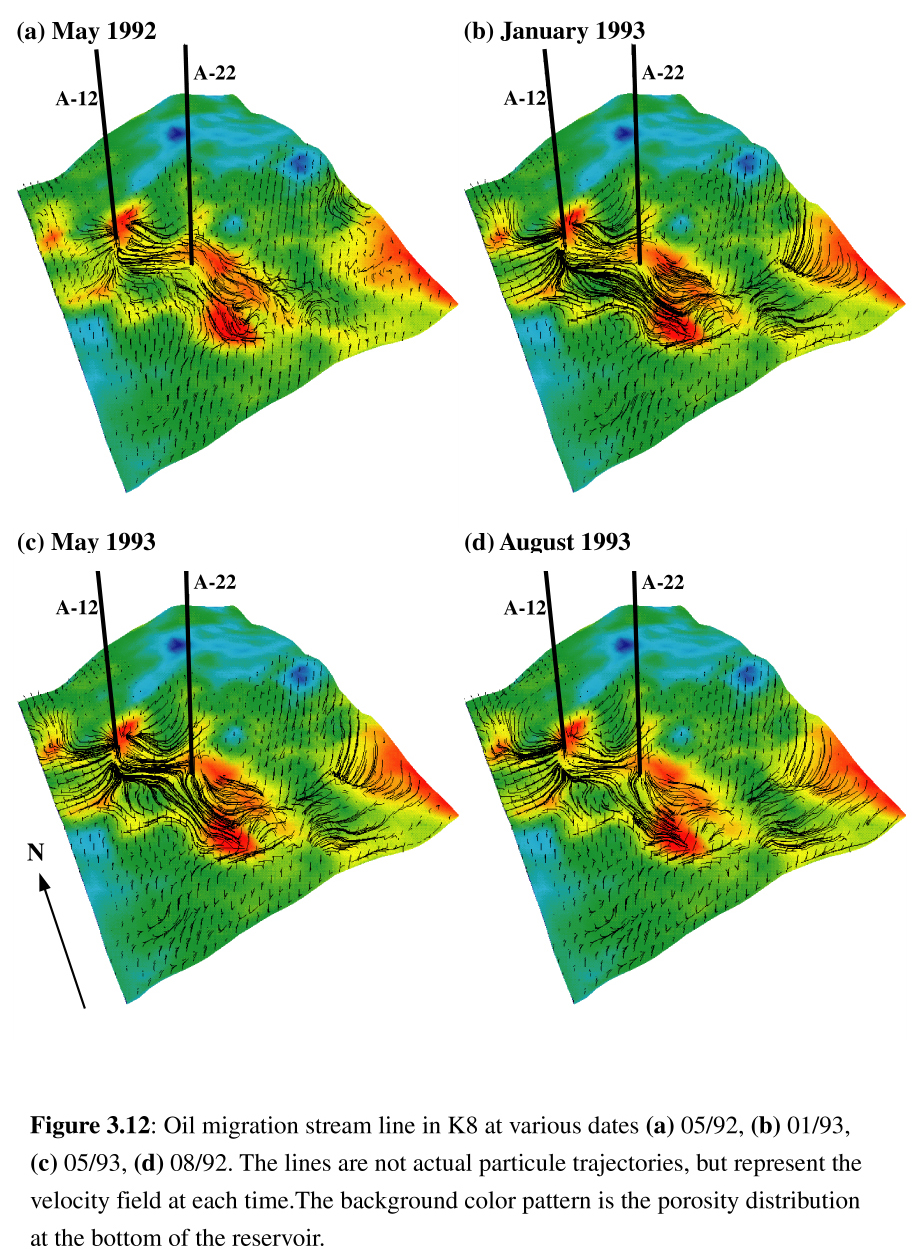
Figure 3.12: Oil migration stream line in K8 at various dates.
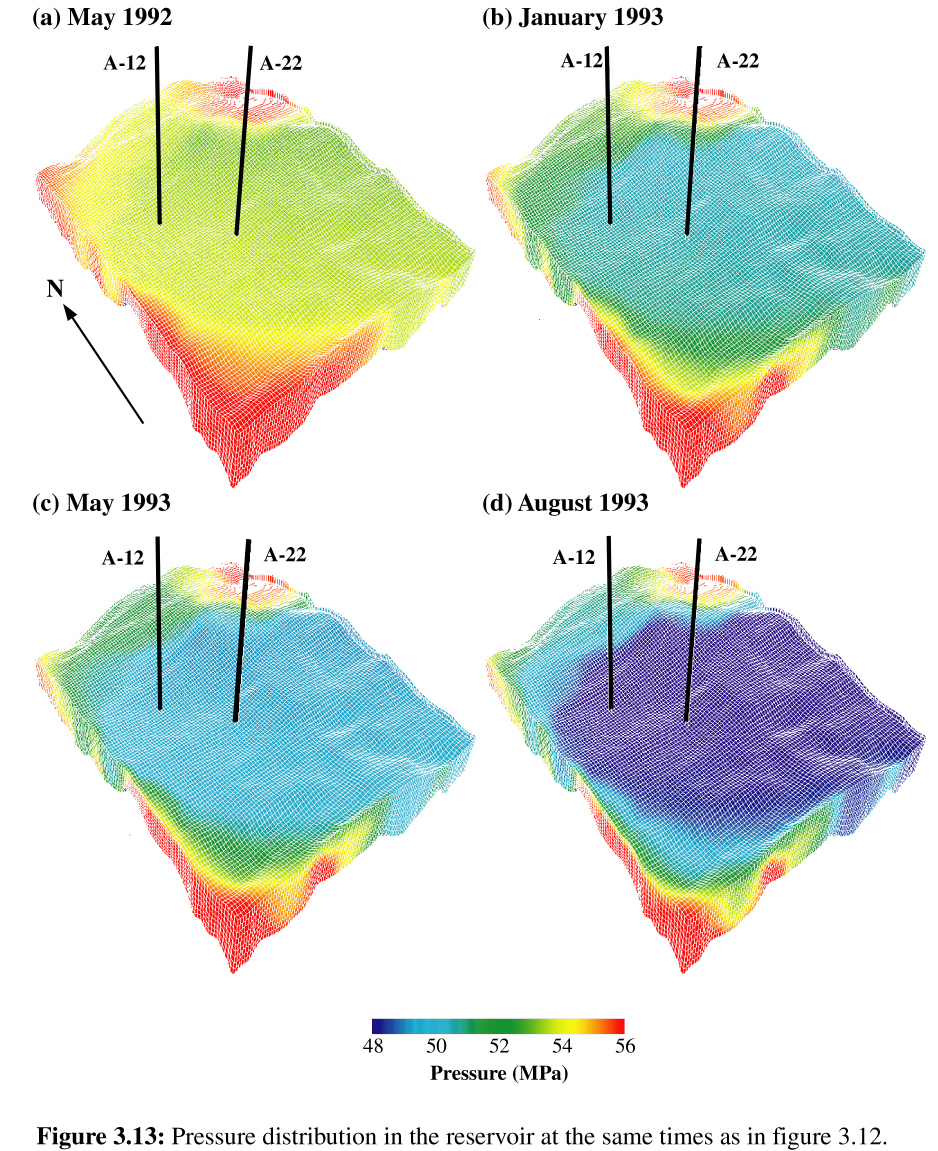
Figure 3.13: Simulated pressure distribution evolution in K8.
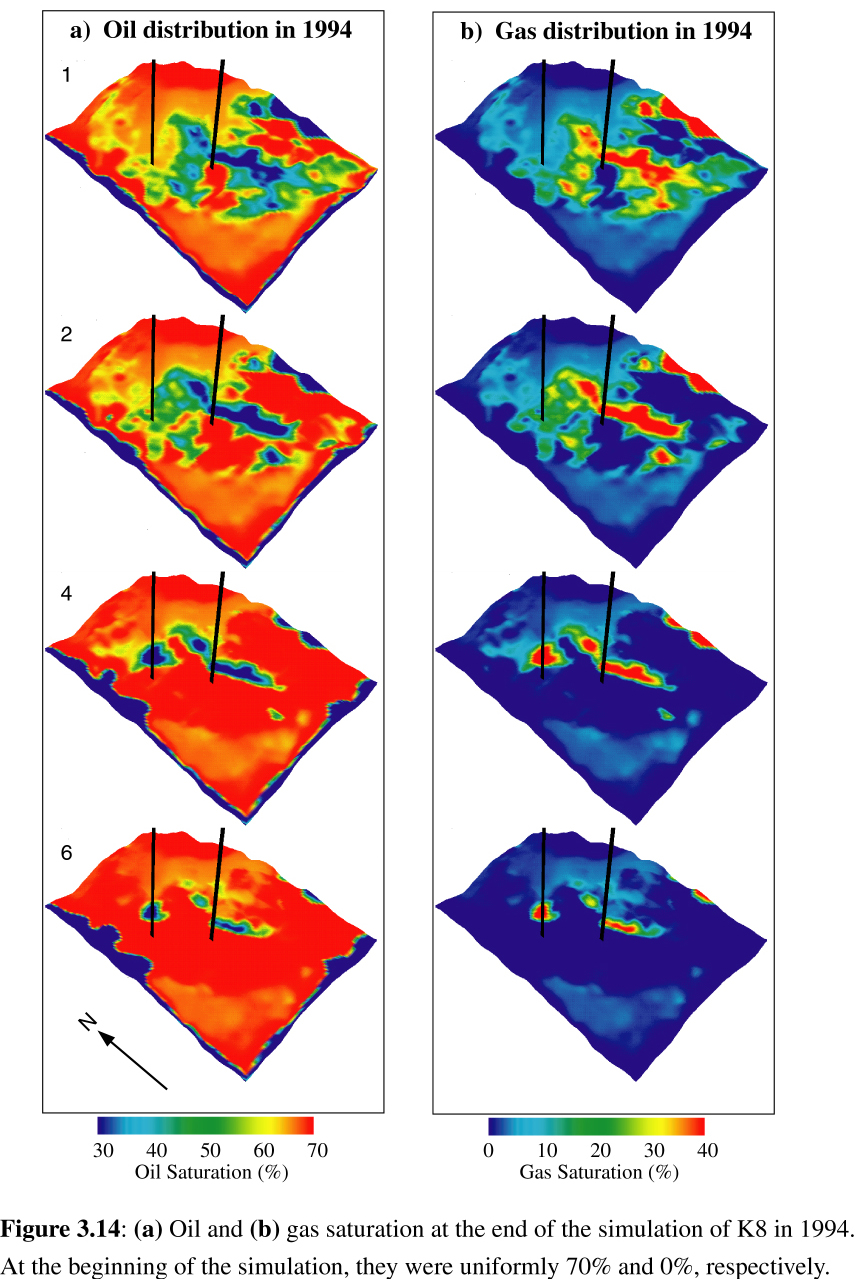
Figure 3.14: Simulated Oil and gas saturation at the end of the simulation of K8.
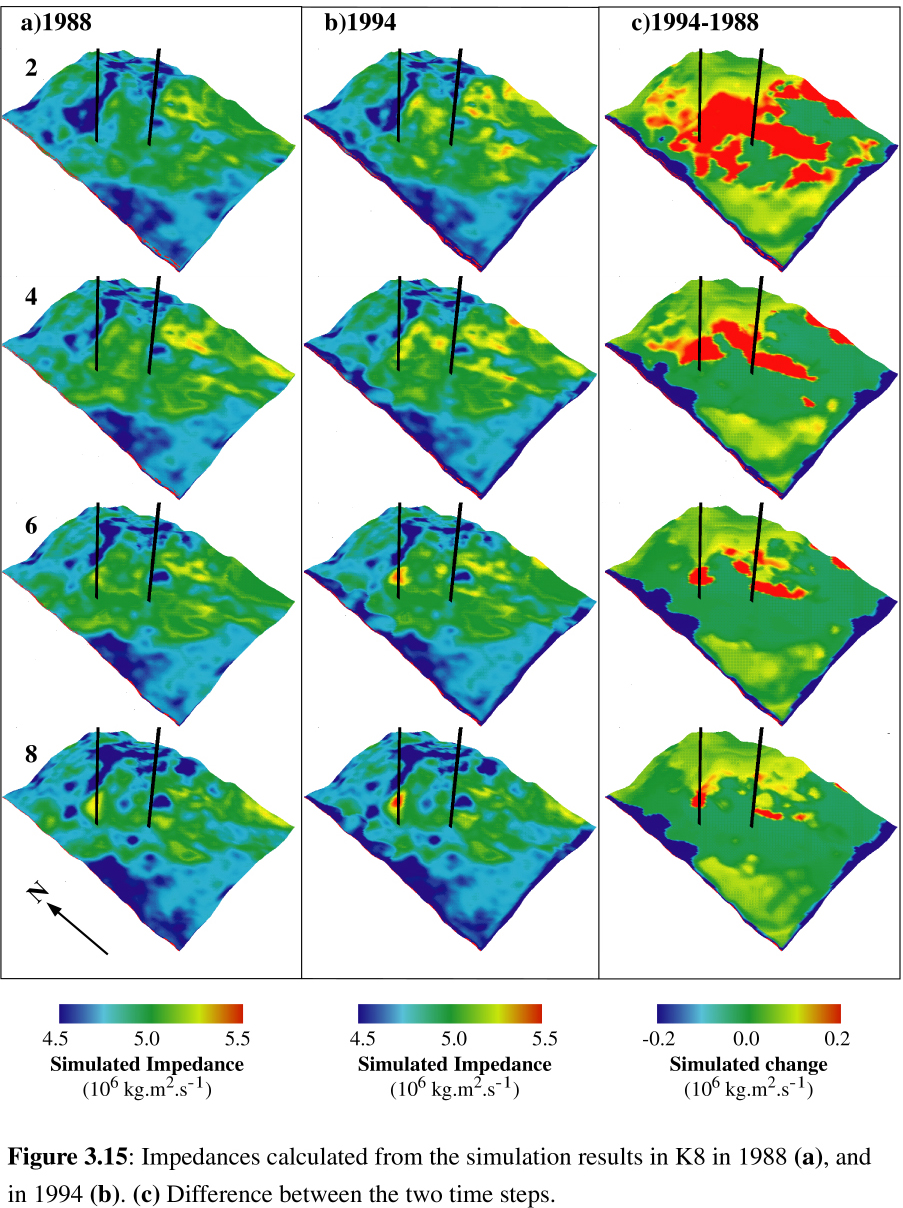
Figure 3.15: Impedances calculated from the reservoir simulation results in K8.
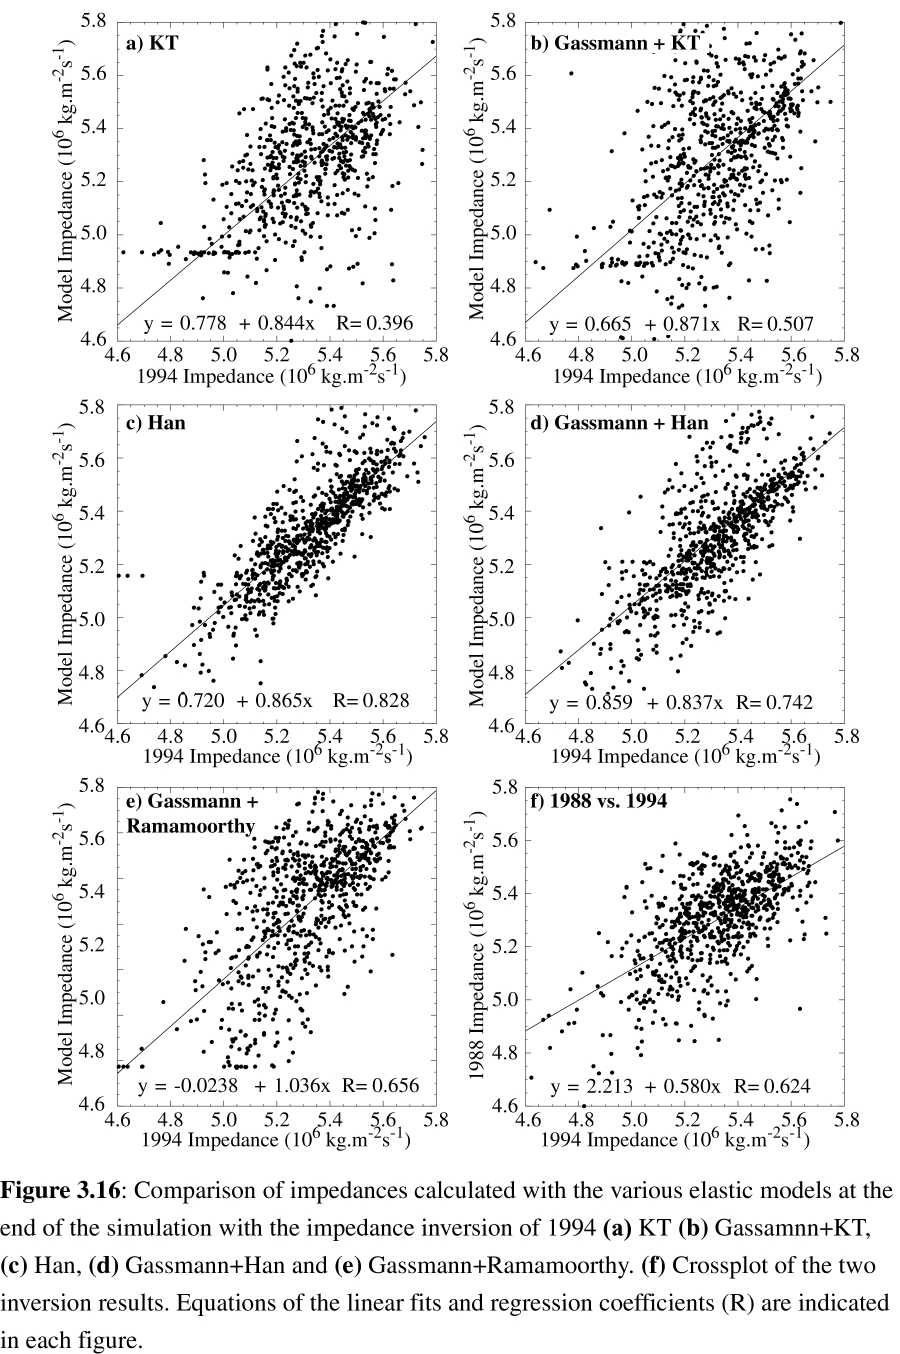
Figure 3.16: Comparison of the petrophysic models at the end of the simulation with the 1994 impedance inversion.
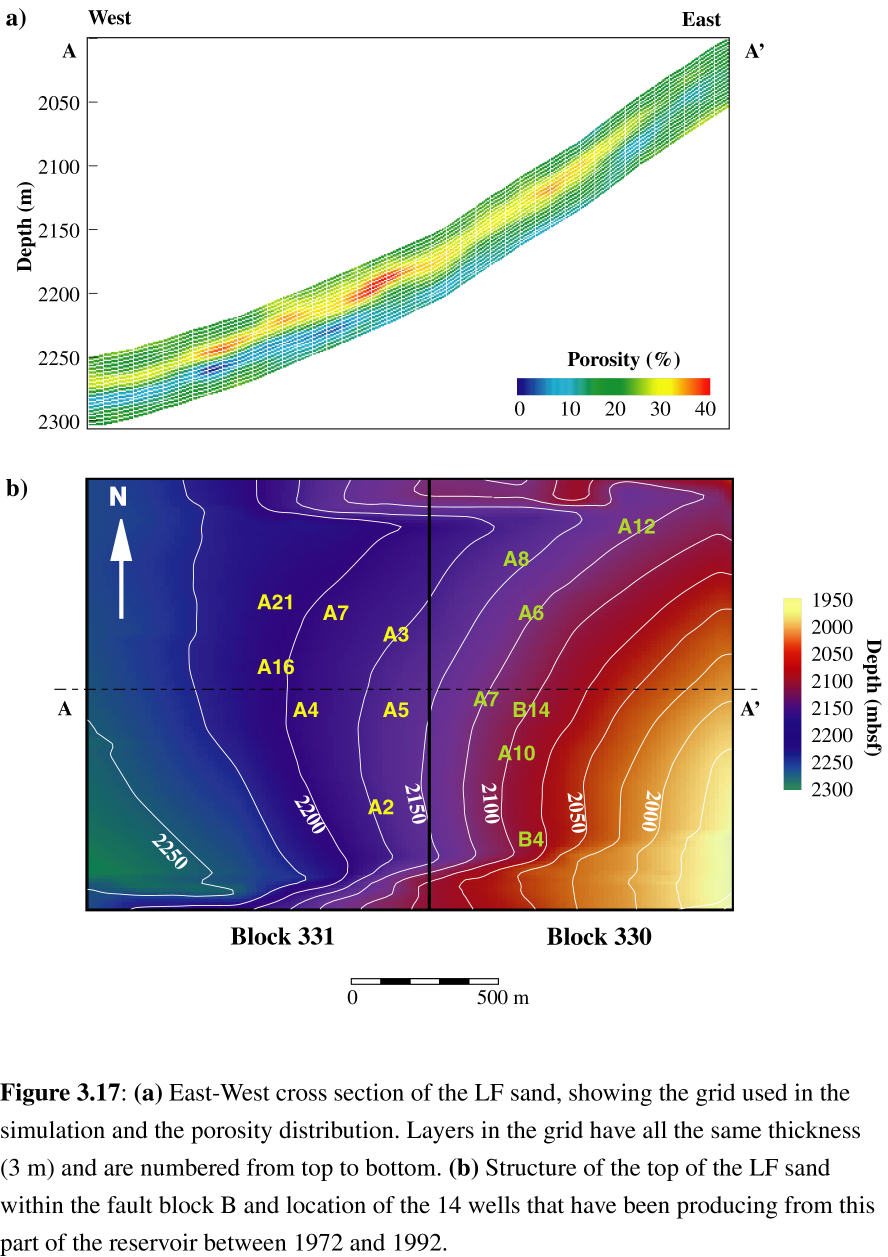
Figure 3.17: Structure of the LF sand, Eugene Island 330.
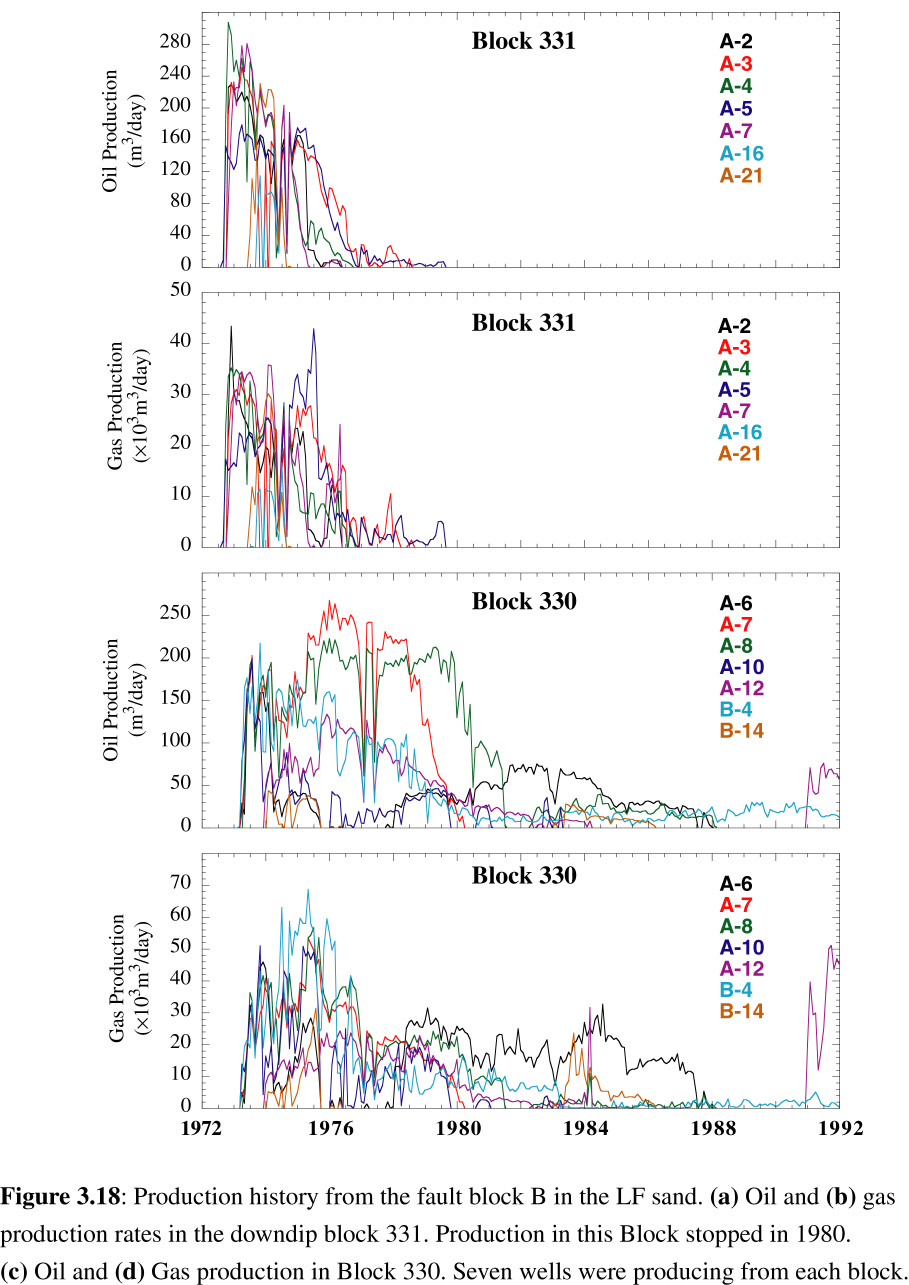
Figure 3.18: Production history from the fault block B in the LF sand.
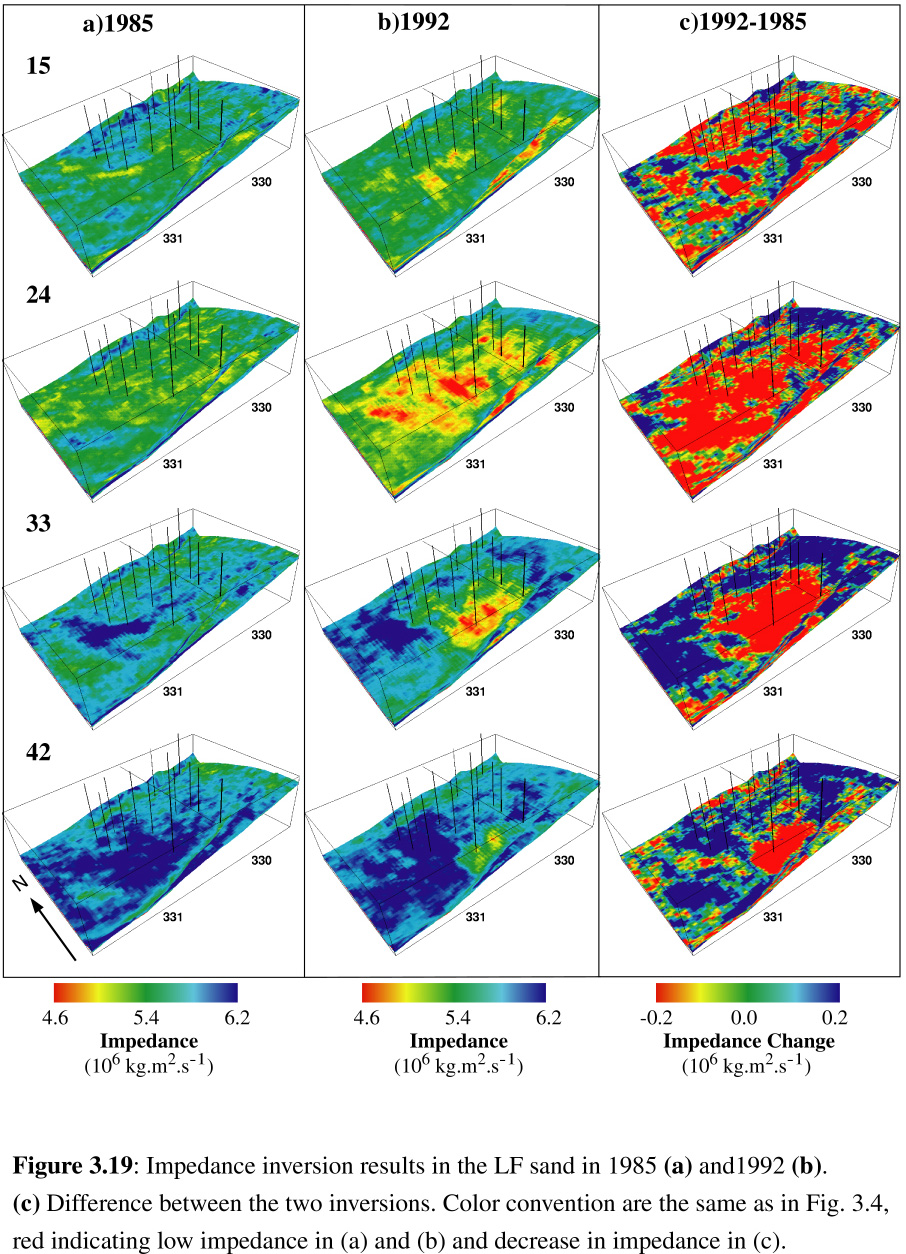
Figure 3.19: Impedance inversion results in the LF sand in 1985 and 1992.
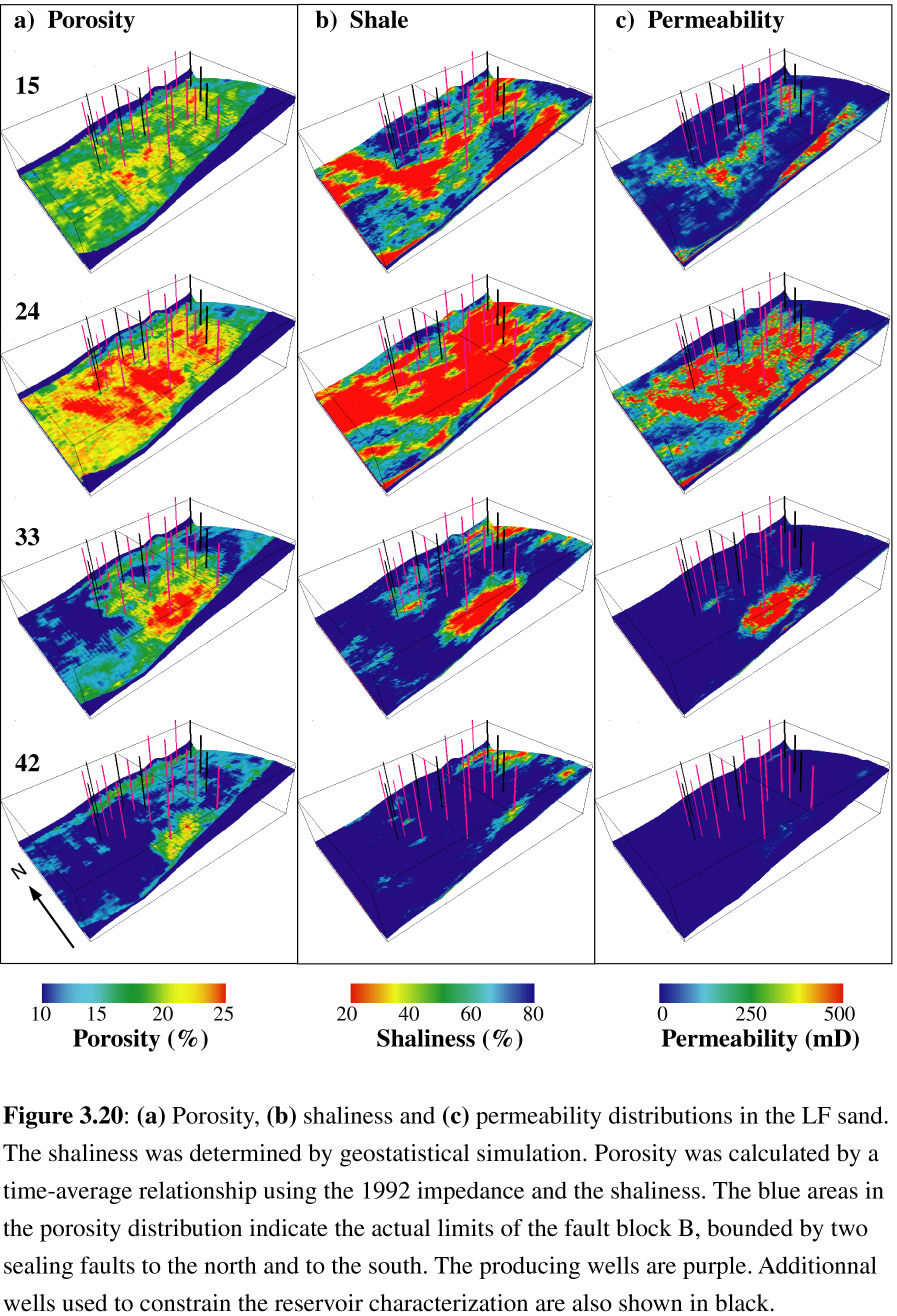
Figure 3.20: Results of the reservoir characterization of the LF sand.
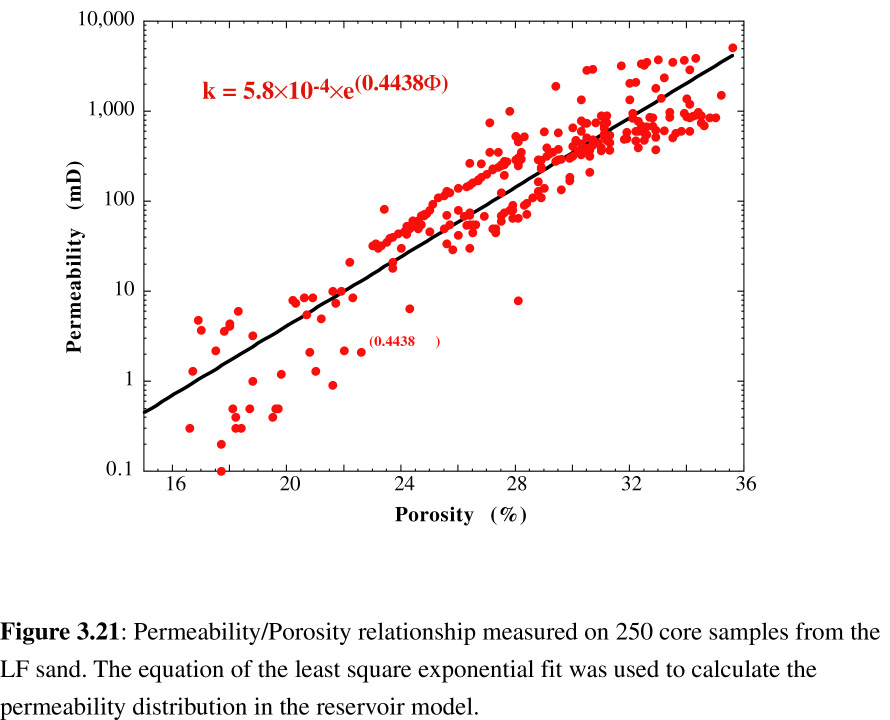
Figure 3.21: Permeability/porosity relationship from LF core samples.
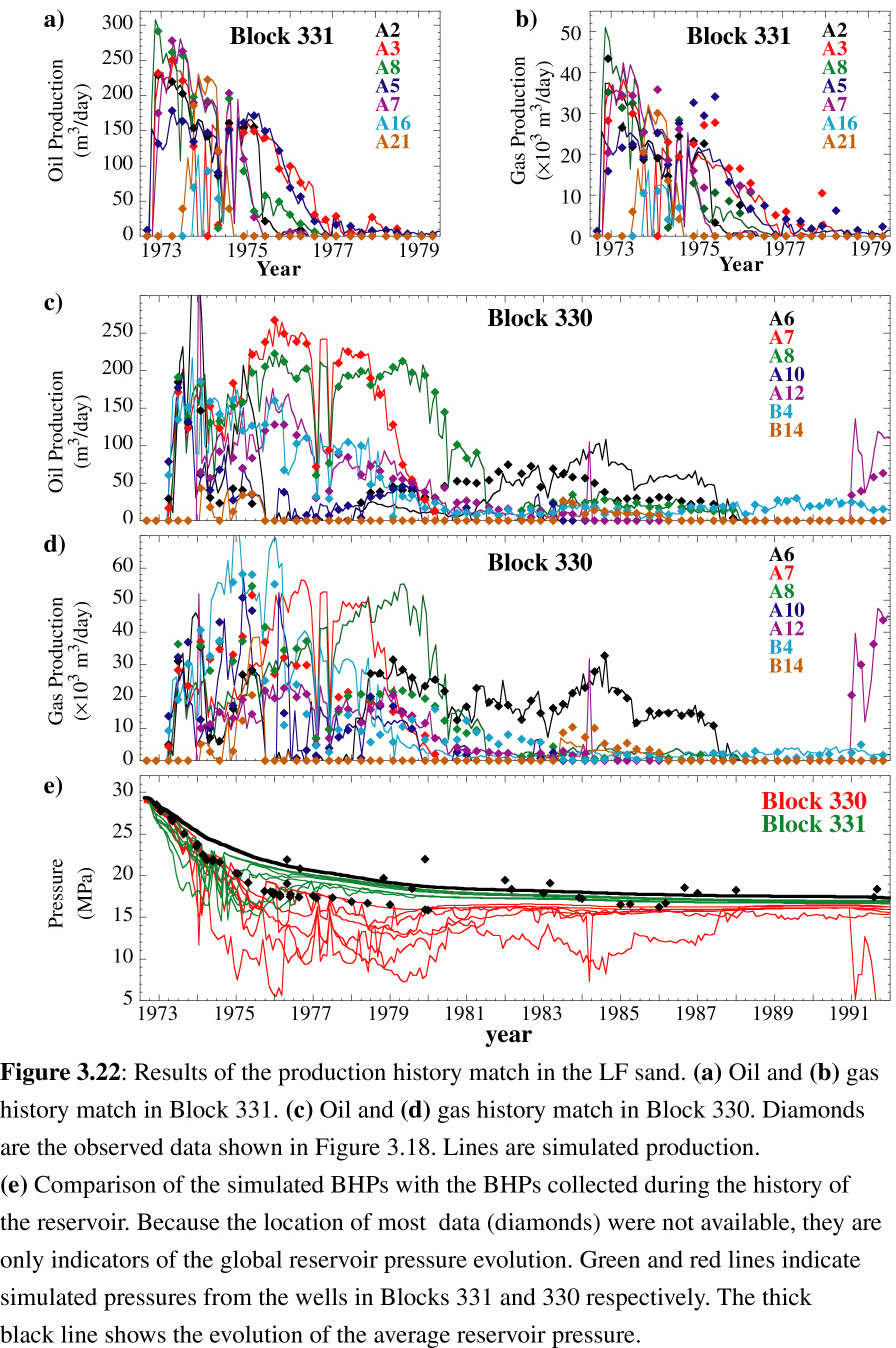
Figure 3.22: Simulated production history match in the LF sand.
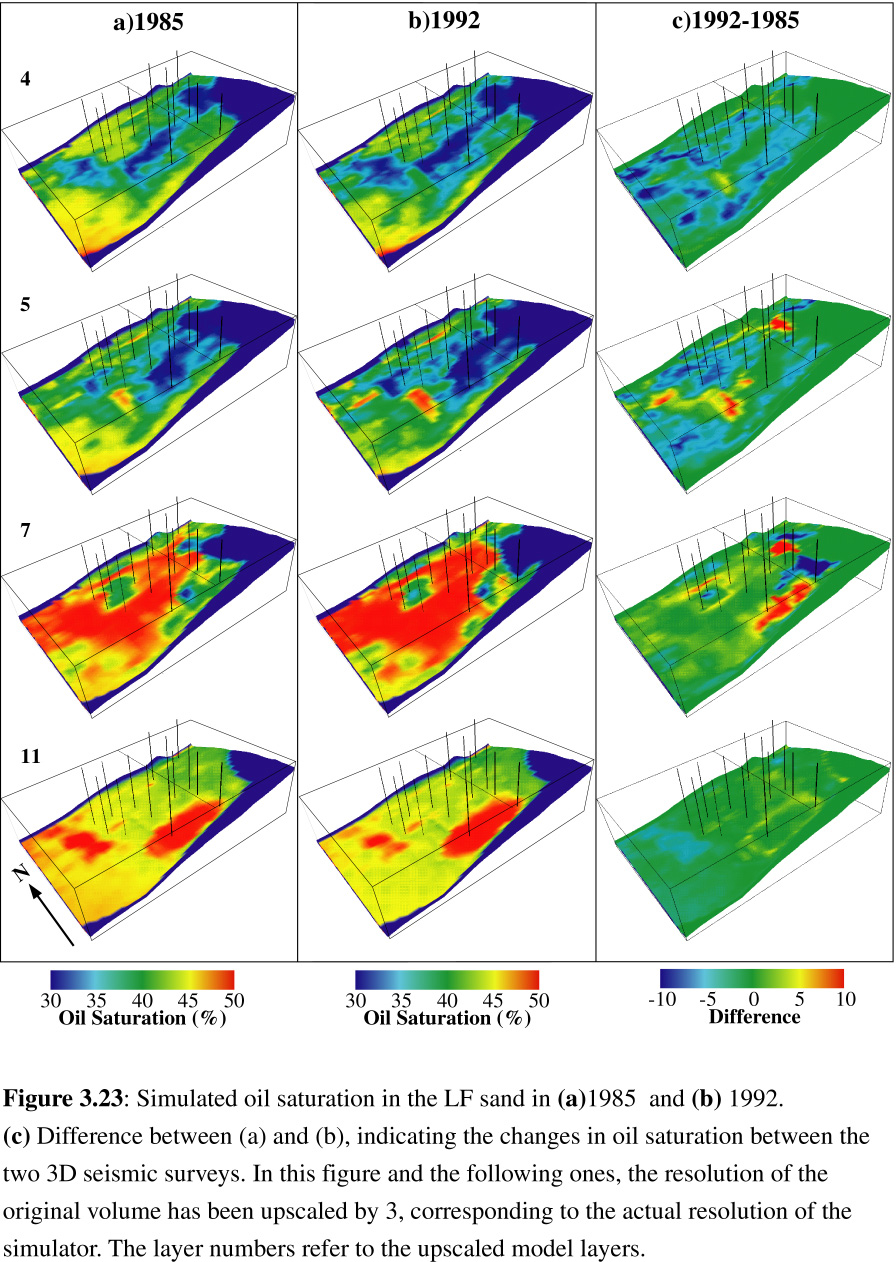
Figure 3.23: Simulated oil saturation in the LF sand.
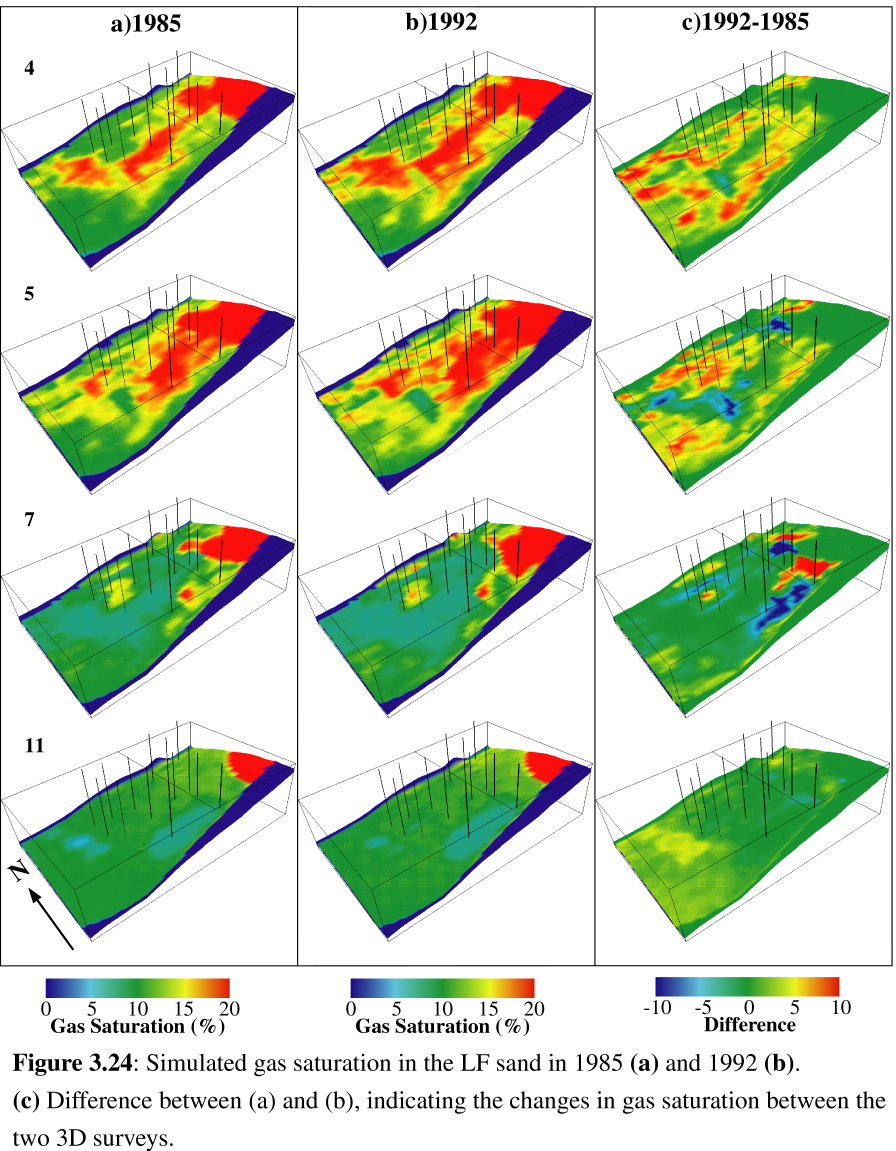
Figure 3.24: Simulated gas saturation in the LF sand.
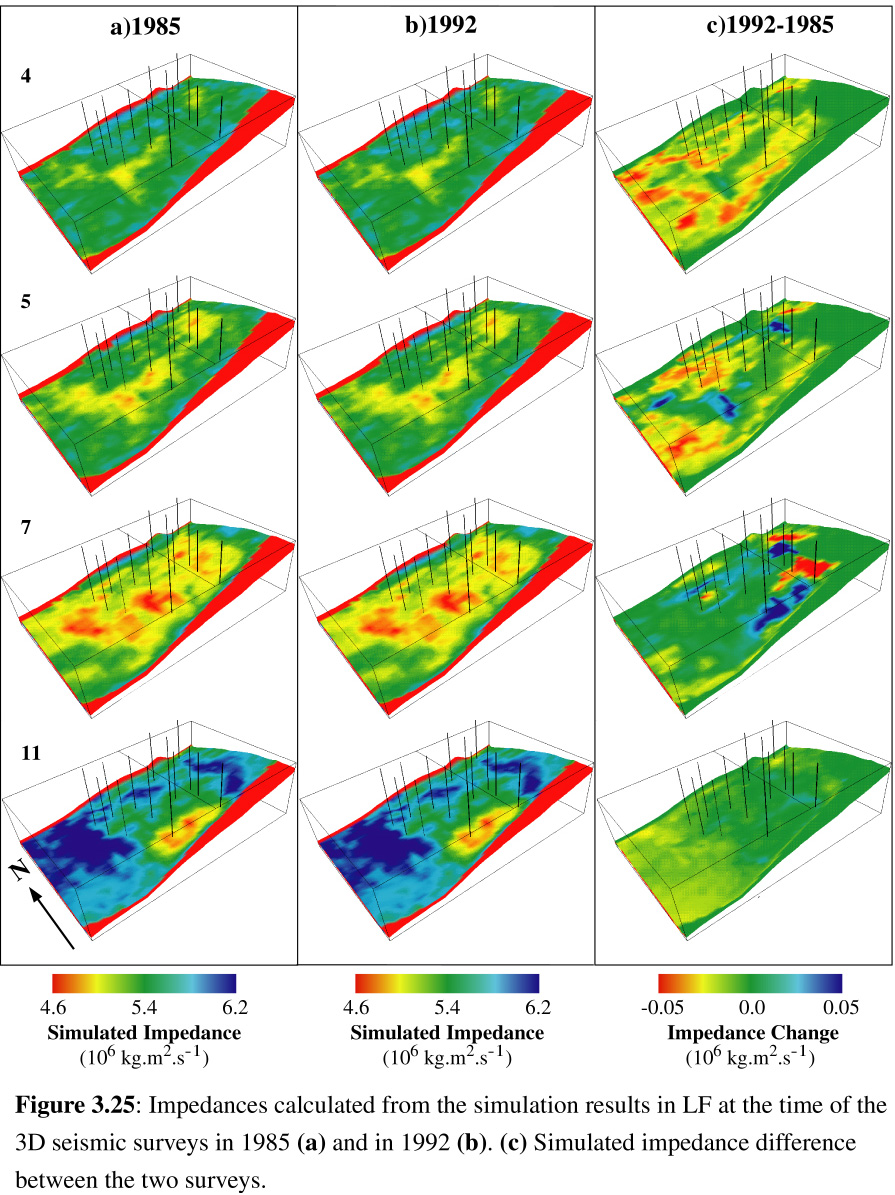
Figure 3.25: Impedances calculated from the simulation results in the LF sand.
Chapter 4: 3D Temperature distributionand numerical modeling of heat transfers in an active fault zone: Eugene Island 330, Offshore Louisiana.
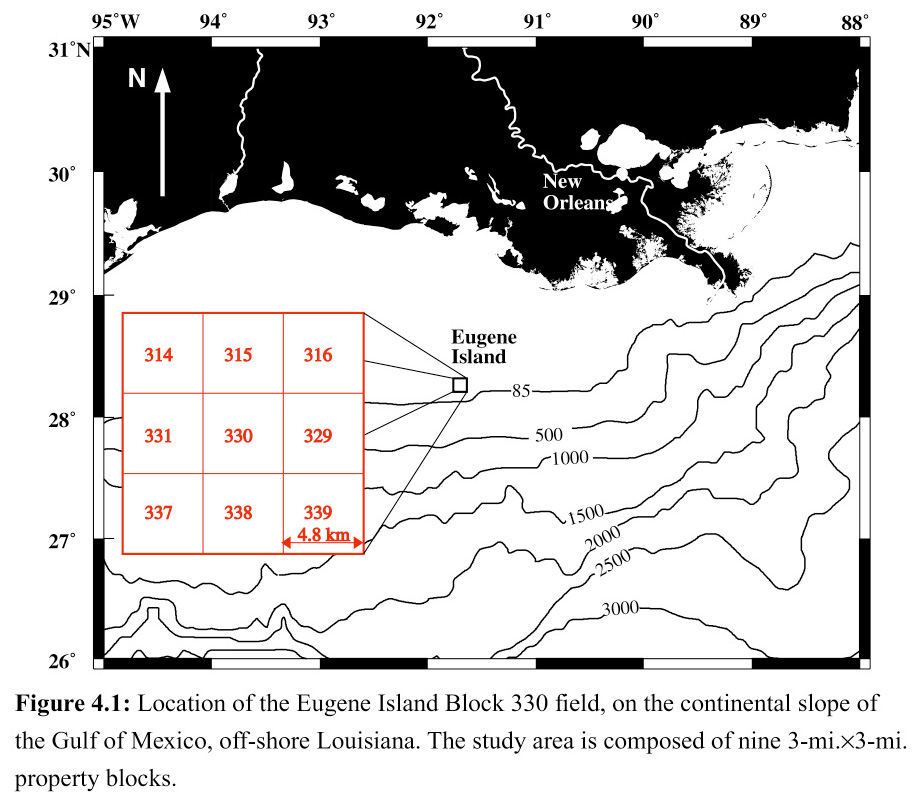
Figure 4.1: Location of the Eugene Island Block 330 field, off-shore Louisiana.
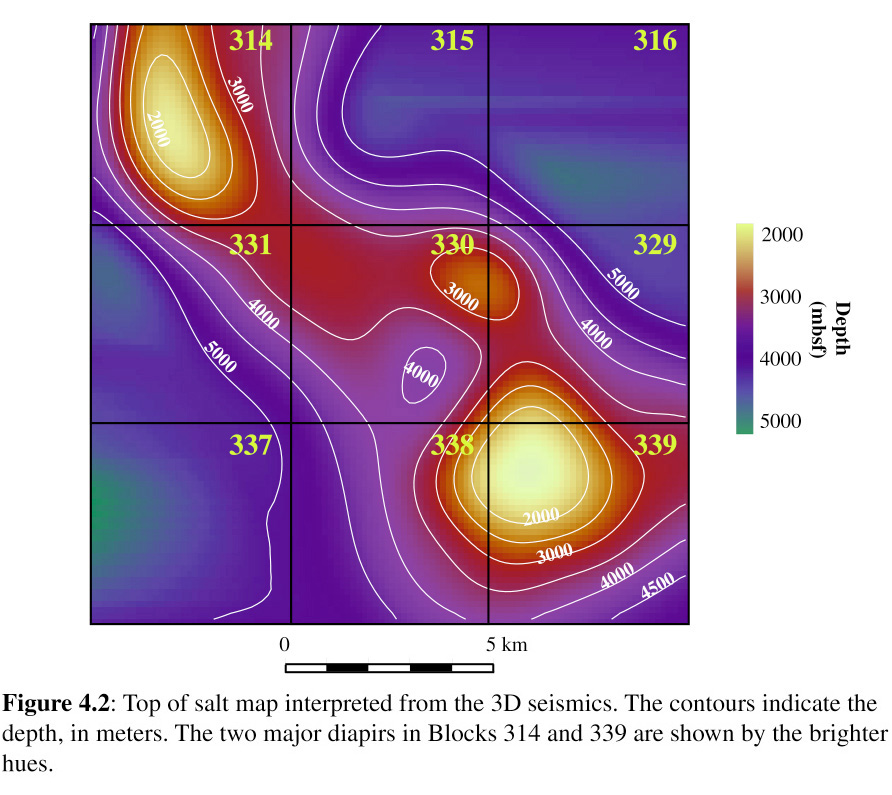
Figure 4.2: Salt structure interpreted from the 3D seismics.
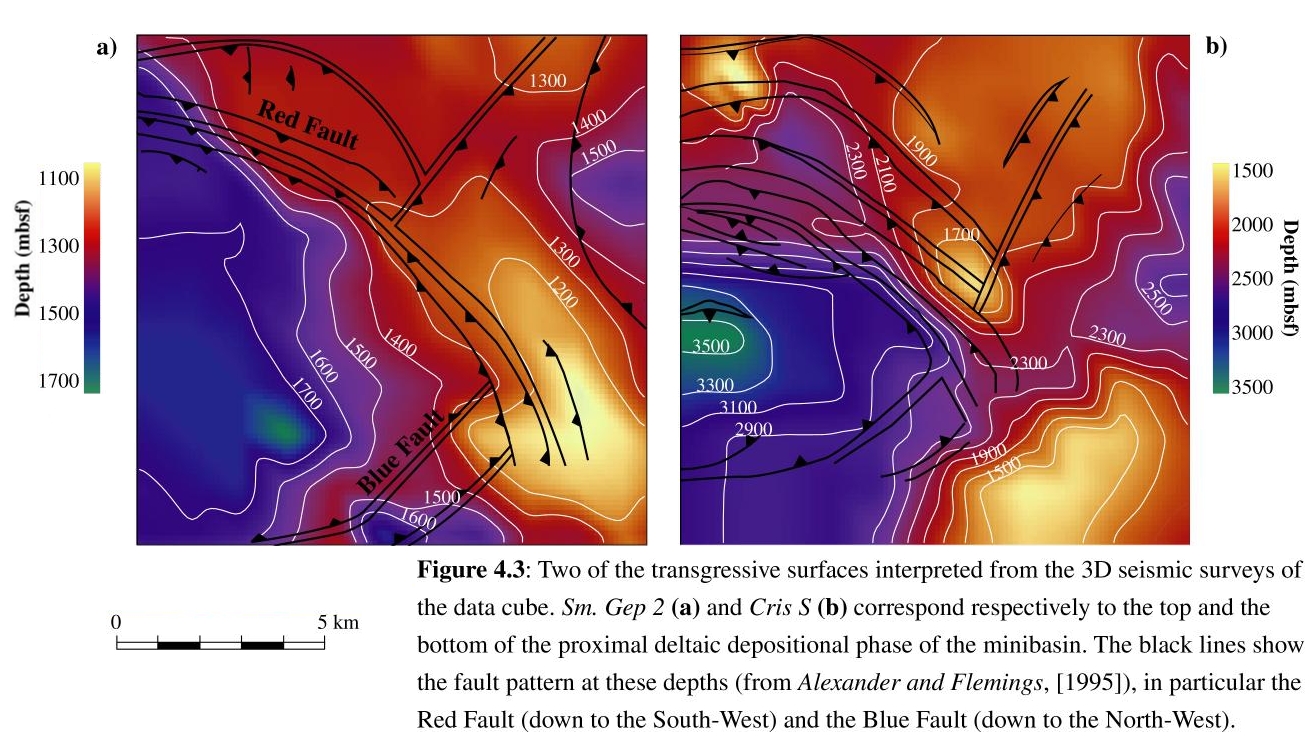
Figure 4.3: Transgressive surfaces used to define the data cube lithology.
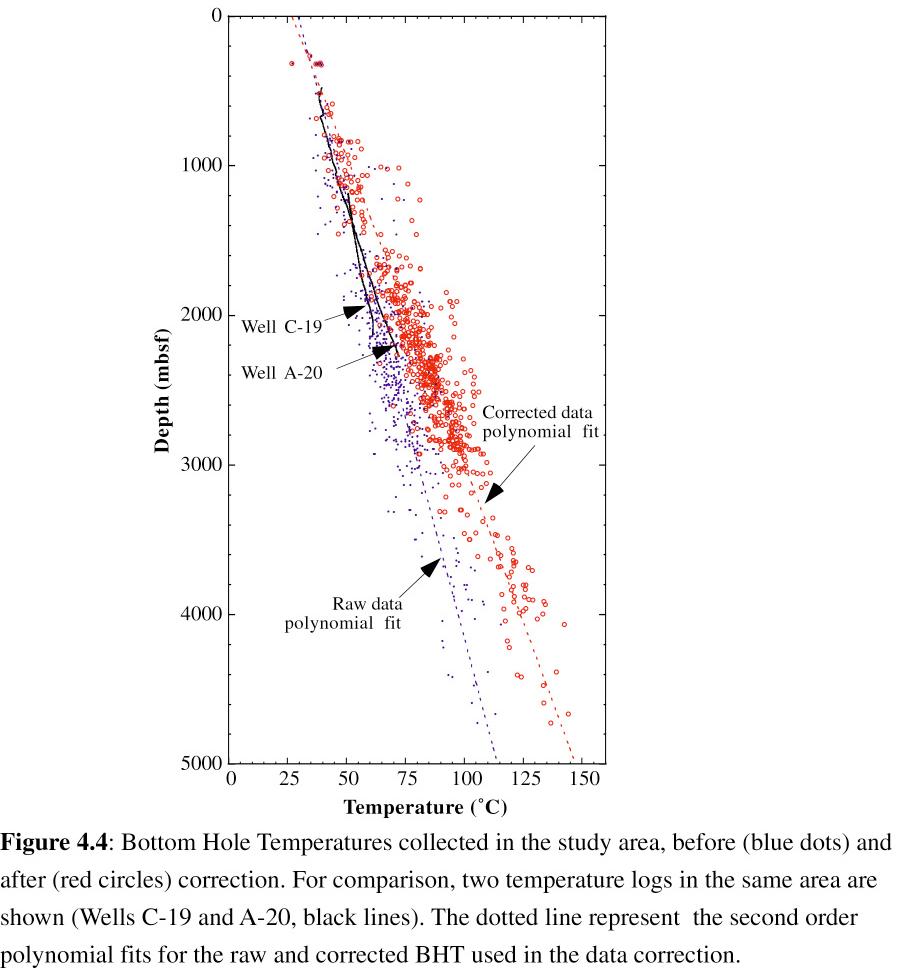
Figure 4.4: Bottom Hole Temperatures before and after correction.
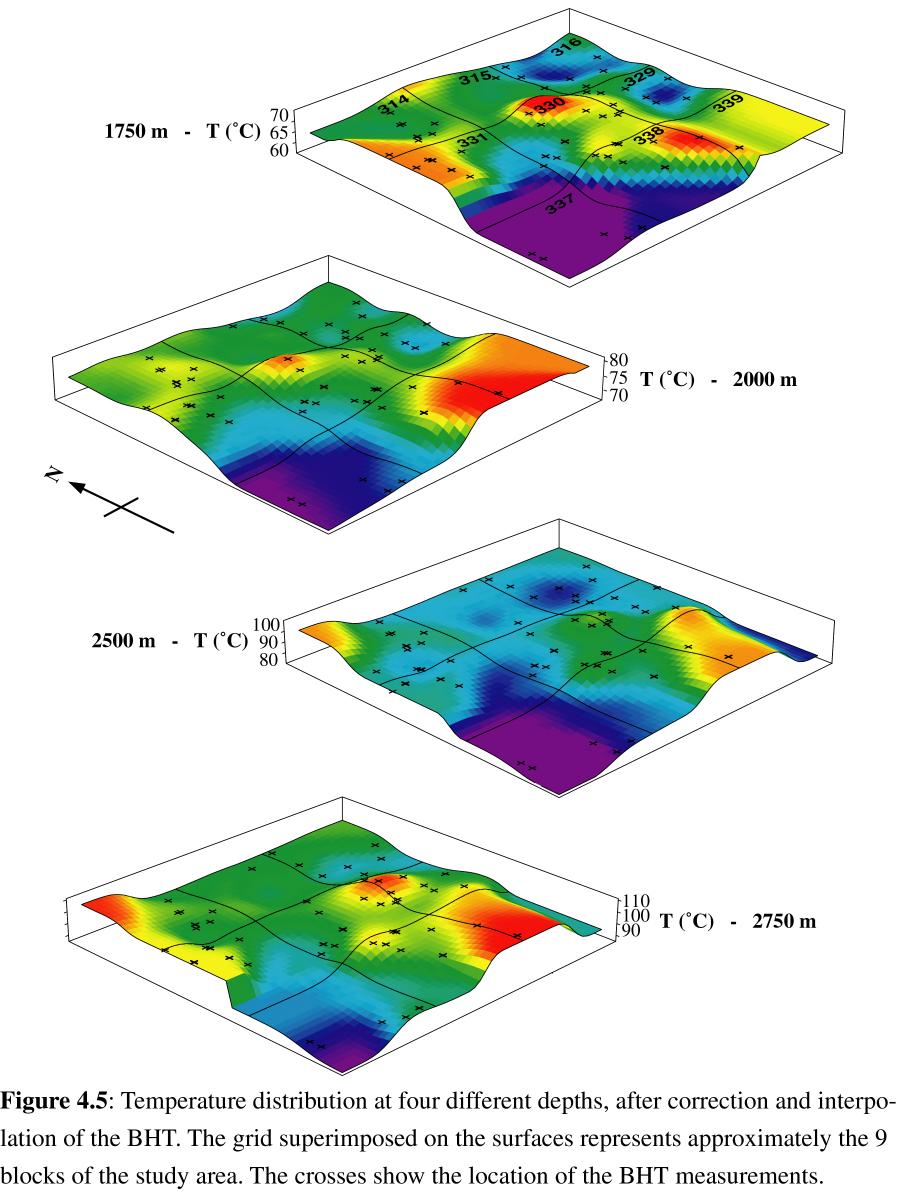
Figure 4.5: Corrected temperature distribution at four different depths.
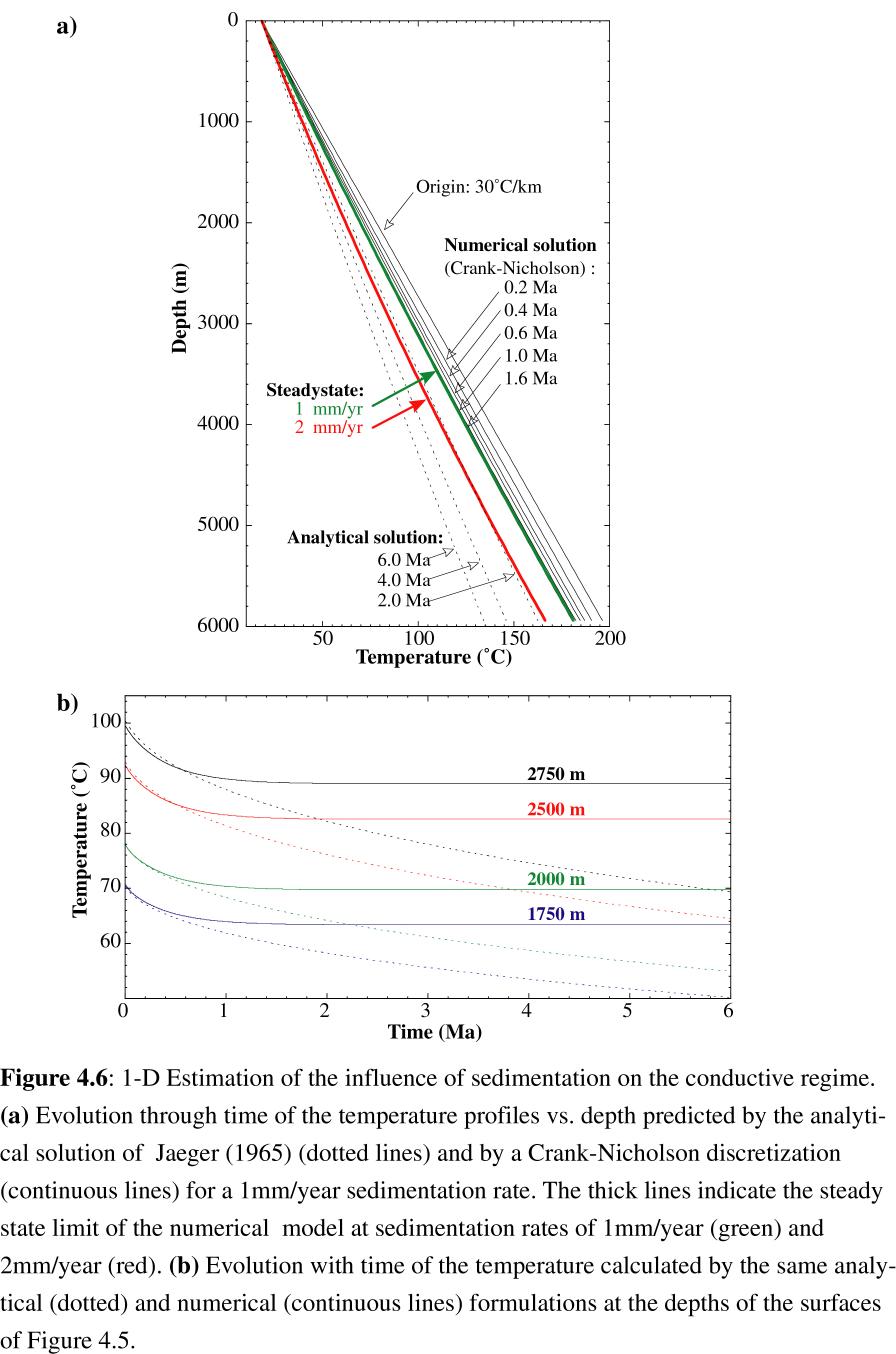
Figure 4.6: Influence of sedimentation on the conductive regime.
Figure 4.7: Representation of the lithology used in the conductive model.
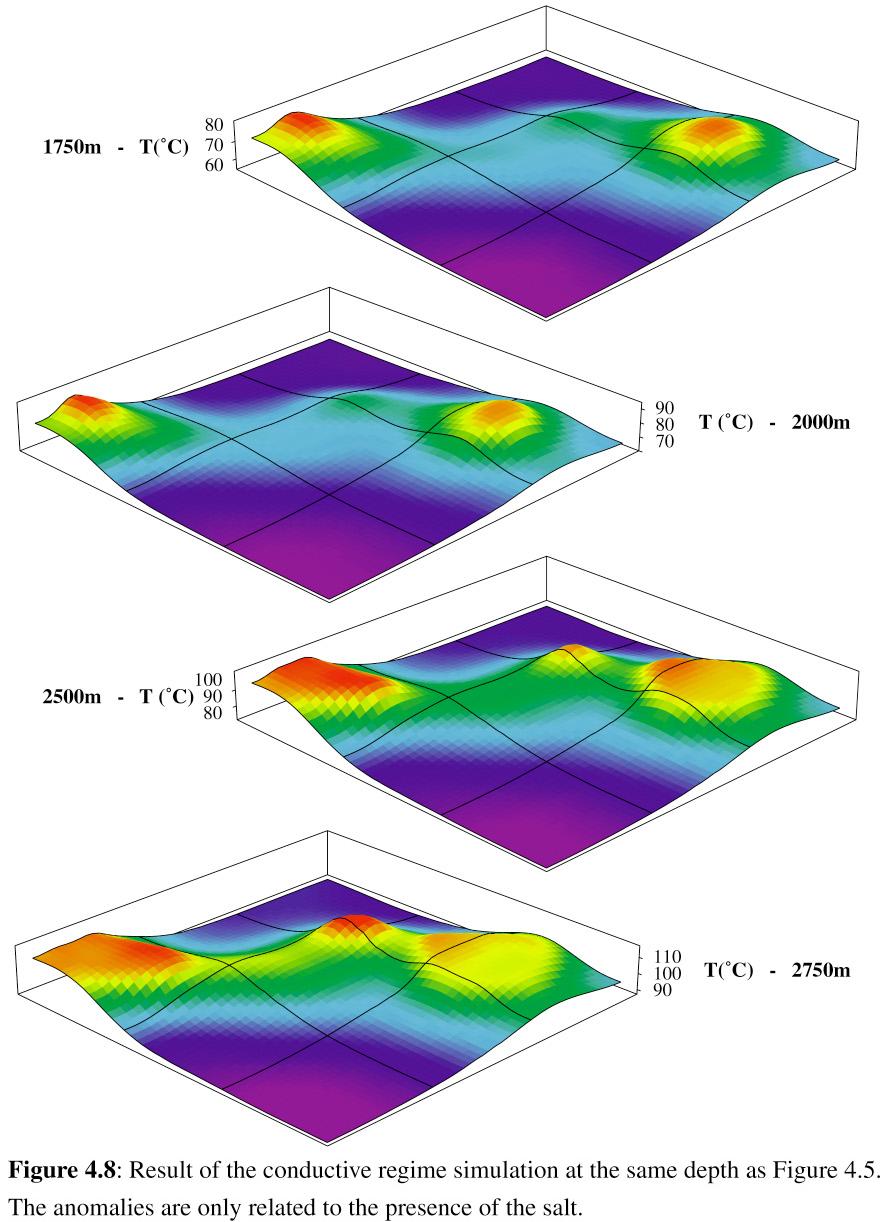
Figure 4.8: Results of the conductive regime simulation.
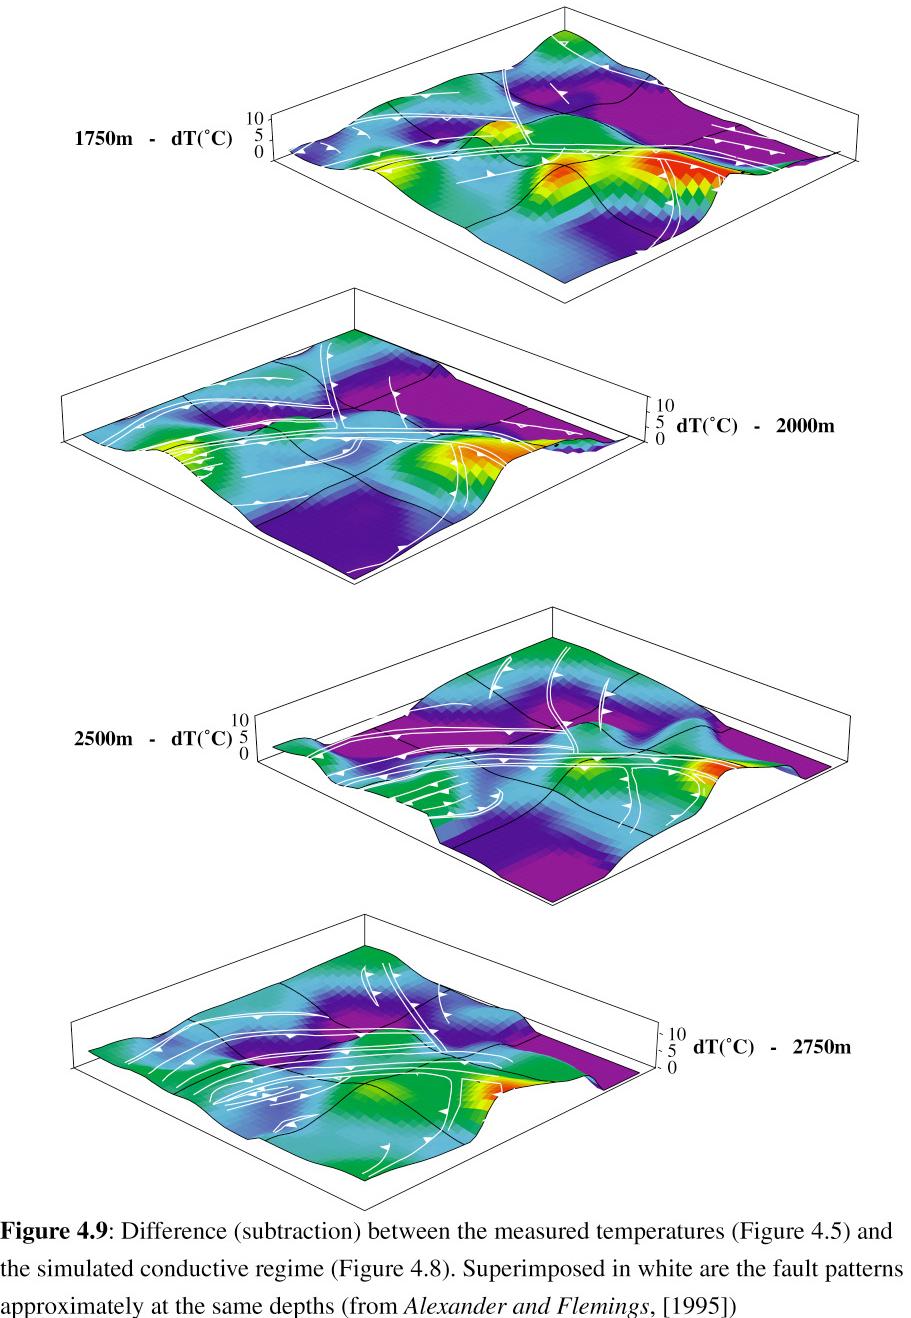
Figure 4.9: Difference between measured temperatures and the simulated conductive regime.
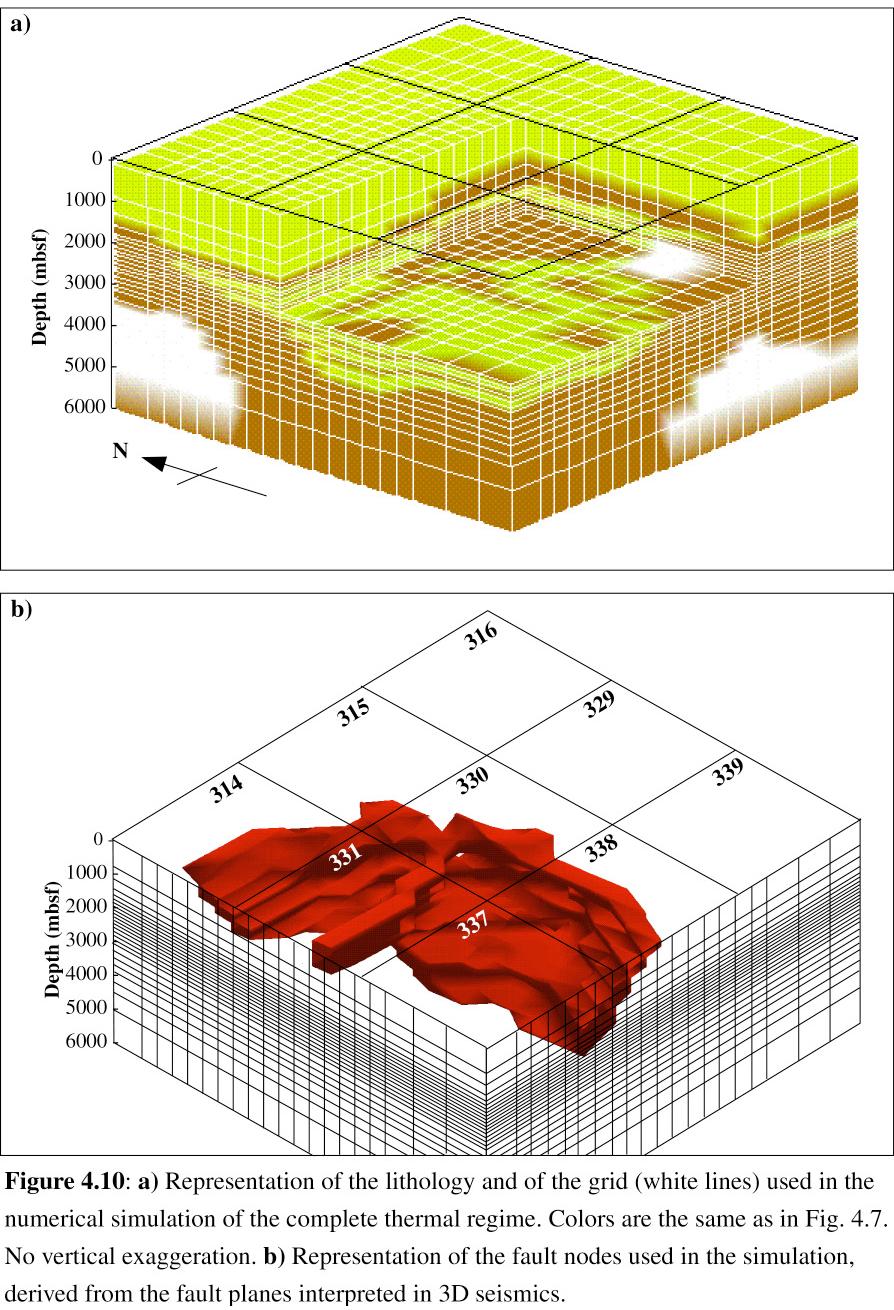
Figure 4.10: Lithology and grid used in the simulation of the complete thermal regime.
Figure 4.11-14: Simulation results for various parameter values.
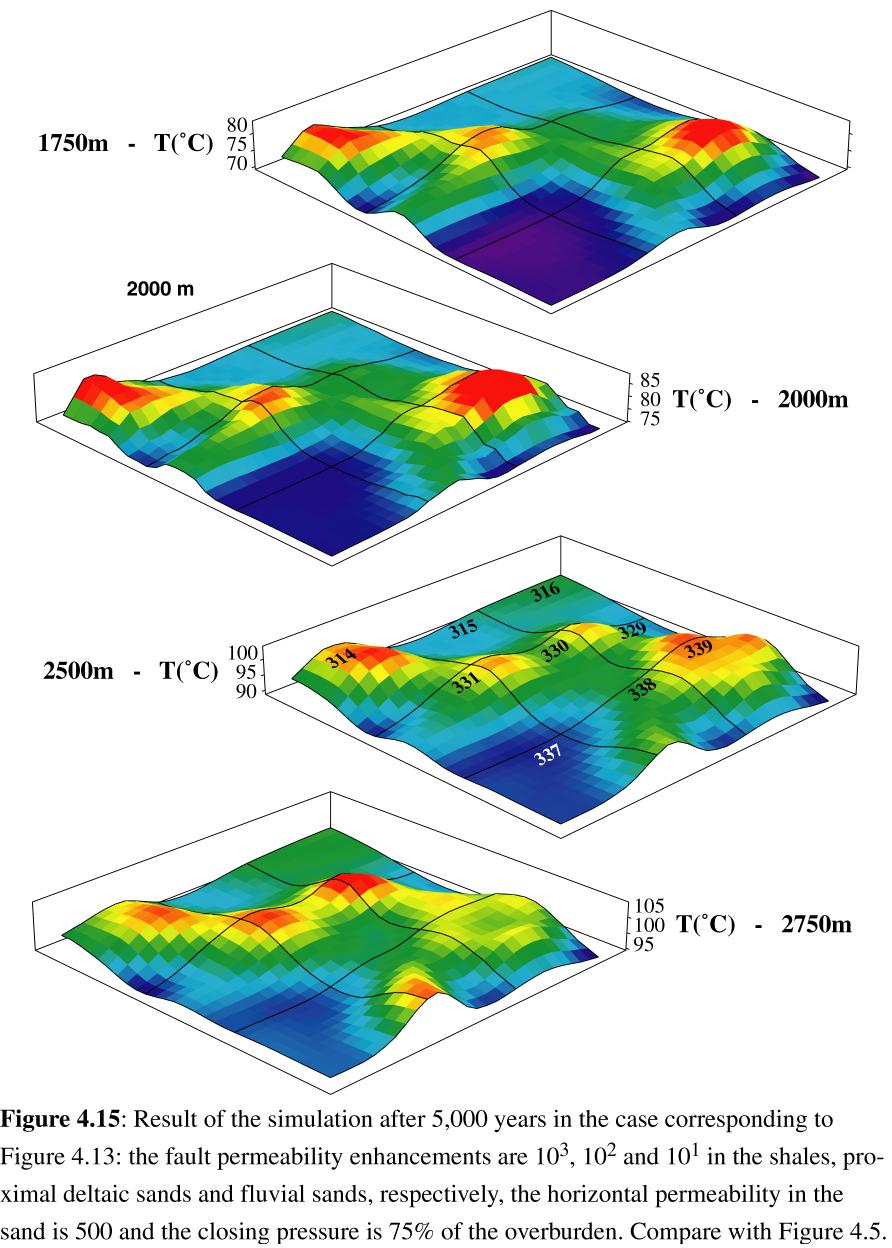
Figure 4.15: Best-matching simulation results after 5,000 years.
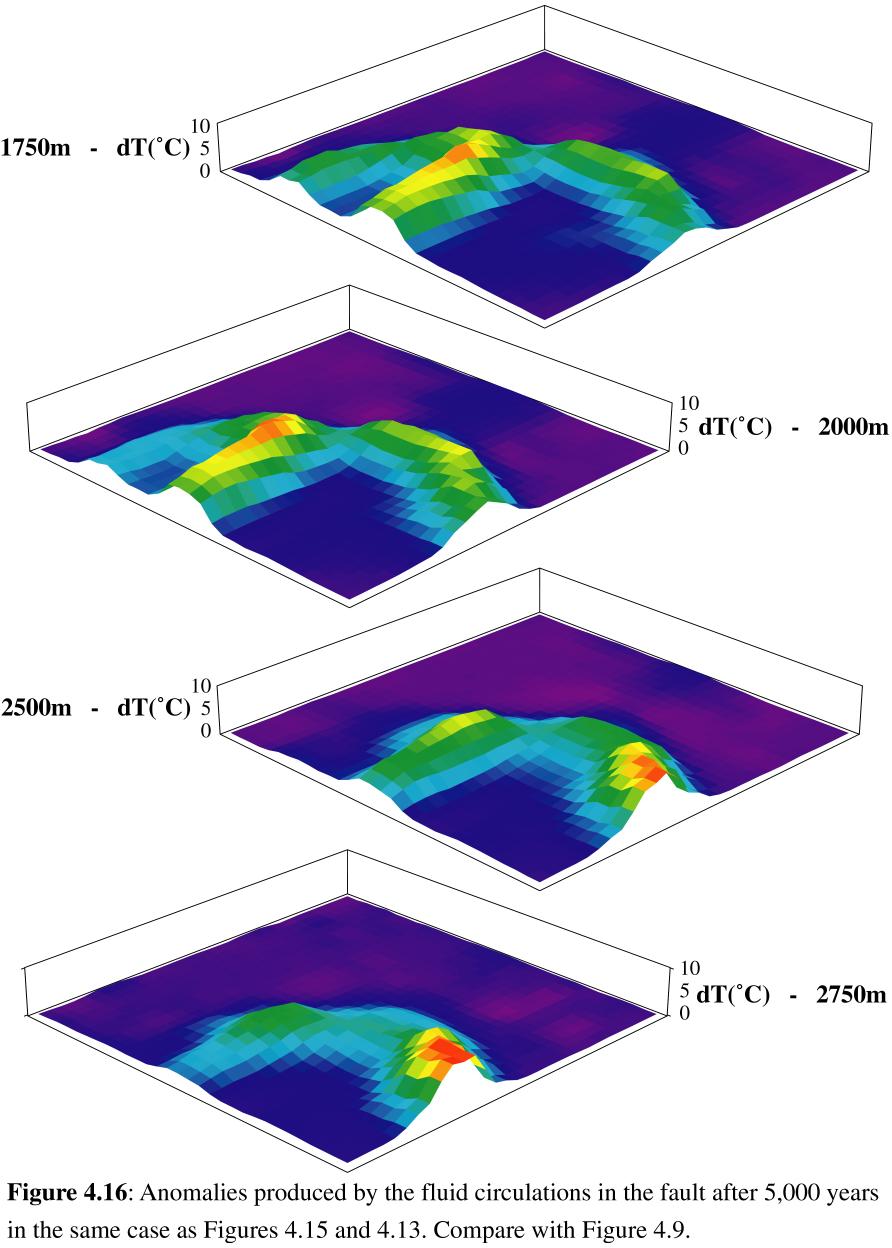
Figure 4.16: Advective temperature anomaly in the best-matching results.
This voyage took many years, and I won't be able to express my gratitude to everyone who by helping me, making me laugh, or just being themselves contributed to its completion and to maintain the little sanity I have left.
Roger Anderson and Dave Goldberg, offered me the opportunity to work with them, and kept me their trust and support all along while giving me all the independence that I value so much. My gratitude for their patience, their generosity, their trust and for their friendship goes beyond words. Bill Menke, Marc Spiegelman and Ulisses Mello were kind enough to review this dissertation and provided me with precious advices on how to improve it.
Robert Gable from the BRGM, France, provided me with crucial support during my first years and was always here for guidance and encouragements. I wish him the most fulfilling retirement.
My most sincere thanks go to the members of the two groups that had to bear with me on a daily basis: the Borehole Research Group and 4-D Technology. Among them Wei He, Gerry Iturrino, Candace Major and Erich Scholz stand out as invaluable friends. Cristina Broglia, Greg Myers, Mary Reagan, Dave Roach, Joan Totton, LiQing Xu, among others, provided me with the finest and most friendly assistance. During the final months, Ule Ninnemann and Julie Carlut also greatly helped bearing the lightness of being.
By their fidelity to the rituals of TG, Drs Jeff Weissel and John Marra, Sean Higgins, Dan Barker, Del Bohnenstiehl, a few others, and most of the Borehole Group contributed to fulfill joyfully even the most frustrating weeks. The support of more occasional 'customers' was also wholeheartedly appreciated. I hope they enjoyed it as much as I did.
And to my family and friends in France, who helped
me maintain my few roots and kept wondering if I would ever come back:
I will.
Dedication
To my parents and brothers.
They are examples of generosity, courage, dignity, simplicity, honesty.
All I know that matters comes from them - I am the most fortunate to have such models.
To Shit Head - in memoriam.
------------------
What do we believe
To live with ? Answer.
Not invent - just answer - all
That verse attempts.
--"Blood from the stone", from Selected Poems - George Oppen
This is the raw data.
A mystery translates it
into feeling and perception;
then imagination;
finally the hard
inevitable quartz,
figure of will
and language.
--"Shore Line", from Amulet - Carl Rakosi
![]()