Climate and water
Atmospheric moisture,
evapo(transpi)ration, condensation, and precipitation
Take away ideas and understandings
-
Water vapor pressure increases with temperature.
-
Definitions of evaporation, evapotranspiration, condensation,
and precipitation and how these processes relate to saturation water vapor
pressure curve.
-
The presence of condensation nuclei are critical
for the formation of clouds.
-
Mechanisms that result in warm and cold cloud formation.
-
Processes that form precipitation and distribution
of precipitation patterns.
Moisture in the atmosphere
-
water undergoes huge expansion during evaporation: 1 g of water equals
1 ml volume in liquid form and 42 l as vapor (at 25oC)
-
gravity concentrates the atmospheric gases near the surface, the pressure
drops to 1/e (= 37%) at about 8 km elevation
-
90% of water vapor content is confined to the lower 6 km
-
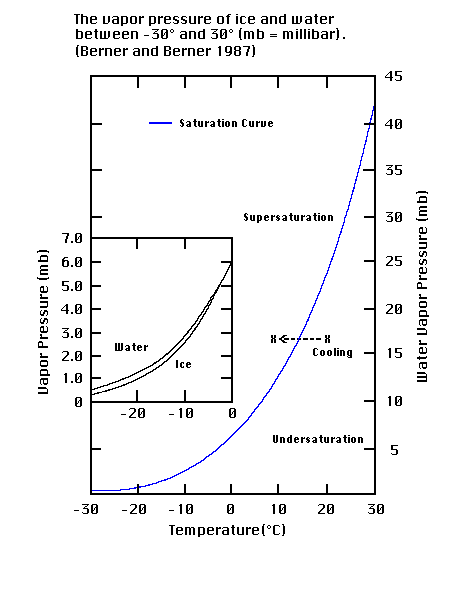
water vapor pressure as a function of temperature (svp = saturation
water vapor pressure) (Fig), can explain
many phenomena in the atmosphere.
-
absolute humidity (or water vapor mixing ratio): mass of
vapor per unit volume of air, in g m-3
-
at 30oC, air has a svp of 42.43 hPa (hPa = mbar) and can contain
up to 30 g m-3, at 0oC svp is only 4.5 g m-3
-
relative humidity: actual water vapor pressure / svp in %; or: actual
water vapor content / absolute humidity
-
formation of fog, clouds, mixing clouds, can be understood in the framework
of the vapor pressure diagram
Evapotranspiration
-
evapotranspiration summarizes all processes that return liquid water back
into water vapor
-
water needed and solar energy
-
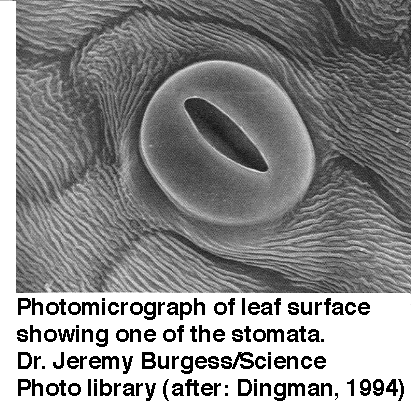
of the water taken up by plants, ~95% is returned to the atmosphere through
their stomata (Fig)
-
potential evaporation (PE), i.e. the
evaporation rate given an unrestricted water supply - different from actual
evaporation
-
how can the actual evapotranspiratio be measured?
-
water balance
-
energy balance
-
or combination of both
Condensation and Precipitation
Definitions
-
condensation:transition from vapor phase to liquid phase
-
precipitation: deposition of liquid water droplets and ice particles
that are formed in the atmosphere and grow to a sufficient size so that
they are returned to the Earth's surface by gravitational settling. Solid
and liquid. Dew and fog do not count as precipitation (can add 5-10% to
precipitation in the Pacific Northwest)
Clouds and precipitation
explanantion of processes through the vapor pressure diagram (Fig):
air rising => expansion => adiabatical (= no heat exchange with
environment) cooling => condensation
at T>0oC: warm cloud process: condensation,
gradual growth of water droplets by condensation, collision and coalescence
at T<0oC: cold cloud process:
involves also the formation and growth of ice crystals
two extra factors are needed to form precipitation:
-
sufficient moisture supply
-
sufficient vertical motion
Warm cloud process
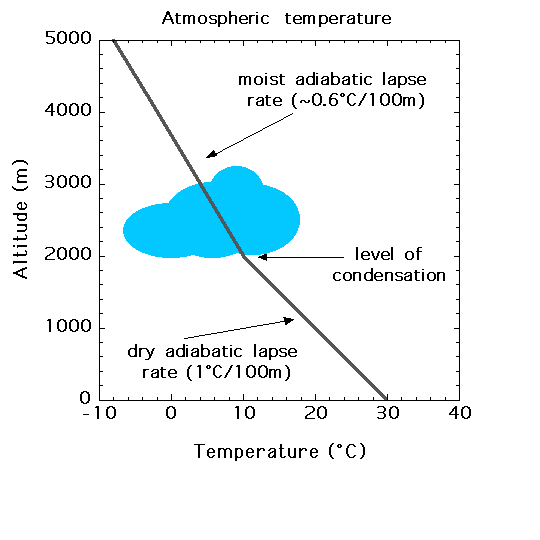
-
a moisture laiden air parcel rises, cools at
dry
adiabatic lapse rate (~1oC/100m) until it reaches the dewpoint,
at
which point condensation occurs. After that, any further rise causes cooling
at the moist adiabatic lapse rate (0.5 - 0.9oC/100m),
because of the released latent heat. (Fig)
-
super saturation: relative humidity > 100%
-
condensation nuclei are needed to increase
condensation
-
most efficient particles: Aitken nuclei (0.01-0.1
micro m)
-
typical source: dust from land, sea spray (hygroscopic!)
-
5 million/l air over land, 1 million/l air over the
ocean
-
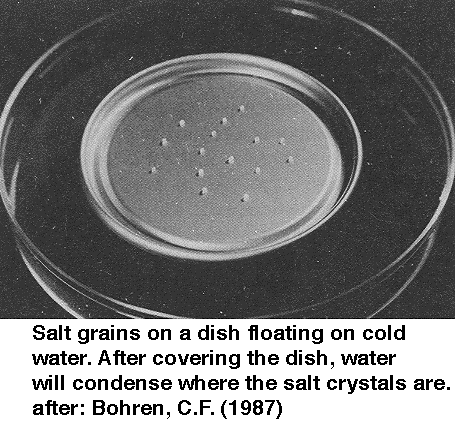
experiment: salt crystals as condensation
nuclei (Fig)
-
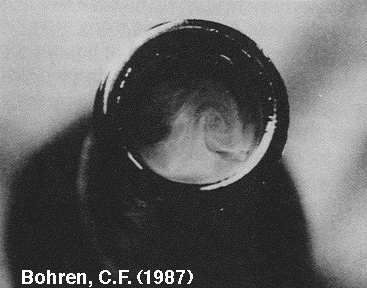
experiment: when a beer bottle is opened,
a cloud forms in the neck. If temp. of the bottle is 5oC, temperature
drops to ~-36oC when bottle is opened (Fig)
-
experiment: when beer is poored into a glass,
bubbles form on scratches and dust particles, adding salt can increase
the bubble formation: clouds in a glass of beer
-
excercise: condensation on a mirror in the
bathroom (Fig); condensation on
windshields
-
condensation only creates droplets < 100 micro
m radius, while raindrops are of the order of 1mm
-
clouds are continuously forming and dissipating, some live only 5 to 15
minutes
-
excercise: how many cloud droplets form one
rain drop?
-
droplets merge due to direct impact and collision
in the wake of falling drops
Cold cloud process
-
saturation vapor pressure is lower over ice than
water => ice crystals grow in favor of liquid droplets
-
ice crystals are very efficient condensation nuclei
-
most efficient in mid latitudes (temperatures low
enough, but enough instability in the atmosphere)
Precipitation patterns
-
kinds of precipitation: drizzle, rain, ice pellets,
snow, hail
-
terminal velocity (v) is achieved when gravitational
acceleration is counterbalanced by the friction of the air, for 1mm diameter
drop: v = 4 m/s
-
raindrops break up at 5 mm diameter, snow can reach
40mm, and hailstones over 50mm
-
moisture in atmosphere: 25% condenses, 75% forms
ice and snow; only 5% of that falls as snow and ice crystals, the rest
melts; a lot of the precipitation re-evaporates before it reaches the ground
-
most precipitation comes from bordering oceans, but up to 40% can come
from local ET.
-
extremes in US: Kauai: 12,000 mm/y, Death Valley: 40mm/y
-
dryest place on Earth: Calama in Atacama desert, Chile, rain has never
been recorded
-
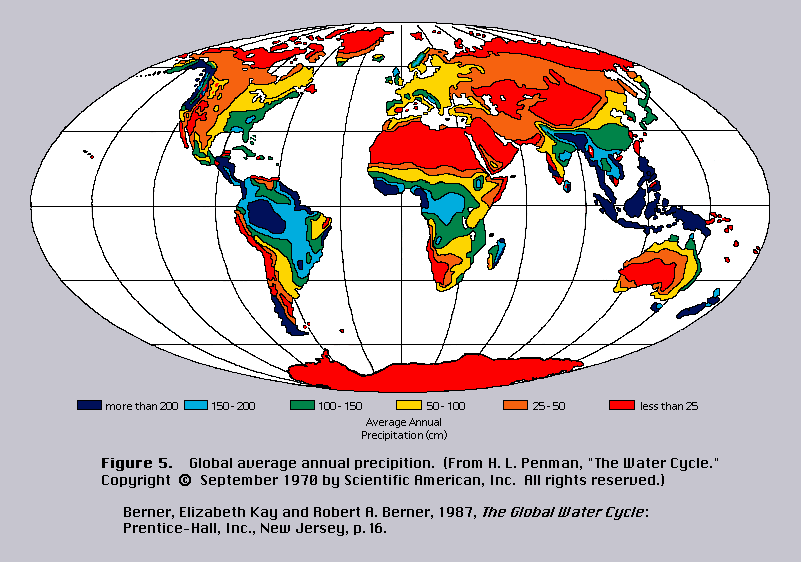
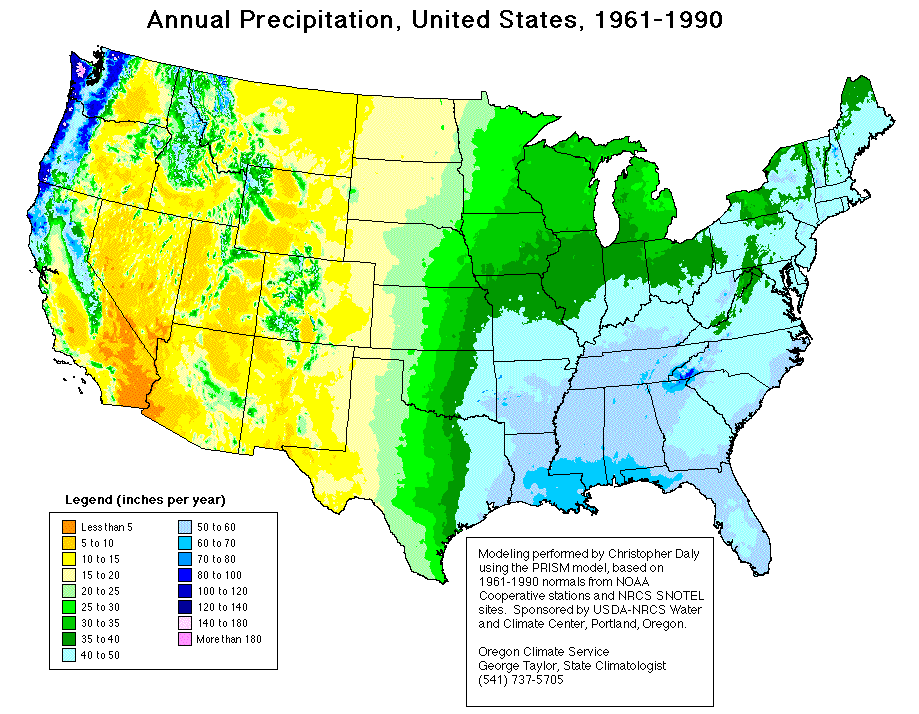
average annual precipitation (global (Fig)
and US (Fig)) onto the
continents is a function of:
-
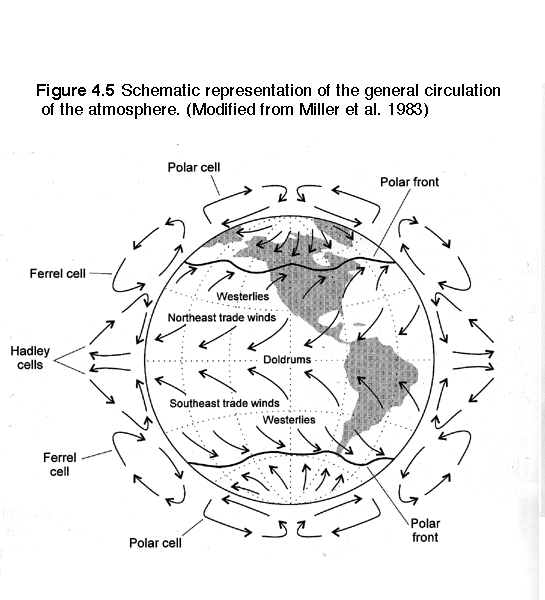
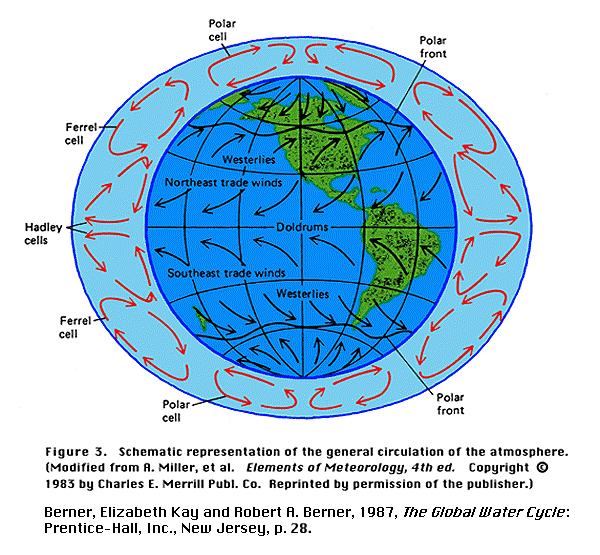
(a) latitude (precipitation highest in latitudes of rising air-0° and
60° north and south-and lowest in latitudes of descending air- 30°
and 90° north and south);
-
global circulation patterns in the atmosphere (Fig)
-
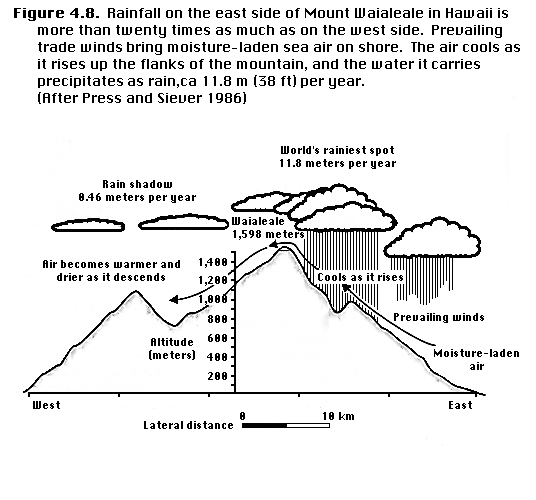
(b) elevation (due to orographic cooling, precipitation usually increases
with elevation (Fig)
;
-
(c) distance from moisture sources (precipitation is usually lower at greater
distances from the ocean);
-
(d) position within the continental land mass;
-
(e) prevailing wind direction;
-
global circulation patterns in the atmosphere (Fig)
-
(f) relation to mountain ranges (windward sides typically cloudy and rainy,
with leeward sides typically dry and sunny)
-
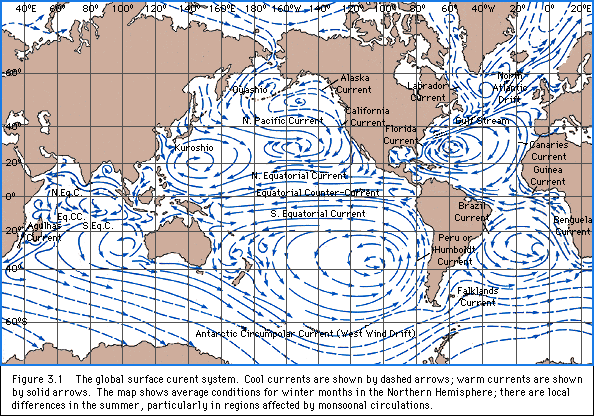
(g) relative temperatures of land and bordering oceans
-
global circulation patterns in the oceans (Fig)
-
excercise:
spatial and temporal variability of precipitation
Point measurements of precipitation
-
Obviously precipitation data are extremely important in hydrology
-
need to measure at many points and need to extrapolate
-
point measurements performed by recording and non-recording gages
-
tipping bucket rain gage
-
snow depth measurements by telemetry, 500 remote sites in US
-
precipitation typically measured as depth
-
many stations all over the world (Fig)
-
the record of hourly precipitation over time is called a hyetograph
and shows that precipitation is organized into discrete storms (Figure
2.3, a station in North Carolina)
Spatial characteristics of precipitation and radar estimation
-
averaging over an area using point measurements at stations (Fig2.4)
-
measurement by radar, radar is reflected from raindrops
-
storm track and total rainfall accumulation during a storm on June 27,
1995 based on radar measurements (Fig2.5)
-
current
radar image
-
radar image of last fieldtrip (Fig)
Temporal characteristics of precipitation
-
our ability to forecast this temporal variation even a few hours in advance
is
limited and our ability to forecast several days in advance is almost
zero
-
if you examined all of the rainfall data for a given region, you would
find an upper limit to
the depth of rainfall per time (precipitation intensity) for a given
duration. (Envelope Curve
for Precipitation)
-
hydrologists apply a technique called frequency analysis to describe
the temporal characteristics of precipitation
-
we assume that precipitation data are samples of a random variable
characterized by a probablility density function
-
only mean annual precipitation appears to be normally (or Gaussian)
distributed (Fig2.7)
-
if normally distributed, precipitation can be described by a mean
and and a standard deviation (Fig2.6)
-
this information is useful to determine the exceedence probability
(the probability that a certain annual precipitation value is exceeded
in a given year) or the return period (the inverse of the exceedence
probability).
-
Excercise: Explore2, global variability of precipitation,
determination
of exceedence probablity using standard deviation, mean and the normal
distribution (Z = (X-mean)/Sx). Use Denver as an example (Fig2.6).
Resources