Next _____ Prev _____ First _____ Last _____ Index _____ Exit
 |
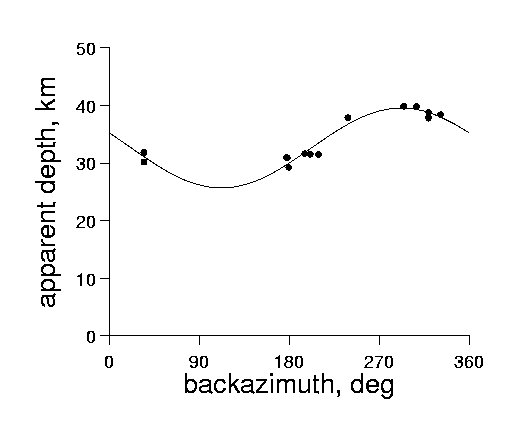
Fig. 6. Apparent Moho depth, plotted as a function of backazimuth, phi. Circles: Depth estimates based on Ps arrivals from three-pulse calculation, calculated for a nominal mean crustal compressional and shear velocities of of 6.50 and 3.69 km/s, respectively. (Solid line) Best fit sinusoid, 32.62+6.93cos(phi-292), indicating that the Moho dips down towards the northwest. |