Next _____ Prev _____ First _____ Last _____ Index _____ Exit
 |
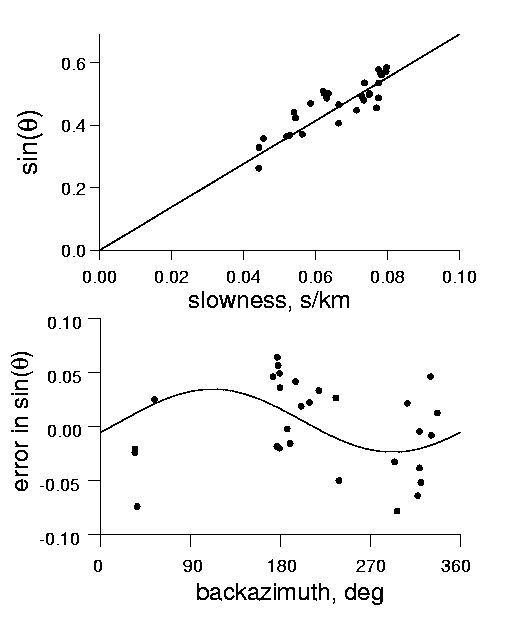
Fig. 7. (Top) Sine of the apparent angle of incidence, theta, inferred from the amplitude of the P-wave pulse on the L=3 vertical and radial-horizontal impulse response functions, as a function of the slowness, p, of the teleseism as inferred from the IASPEI Tables (Kennett 1991). The data (circles) are compared with a best fit straight line with slope of 6.03 km/s (solid curve). (Bottom) Deviations of the sin(theta) data (circles) from the straight line fit as function of the backazimuth of the teleseism. Solid curve: best fit cosine. |