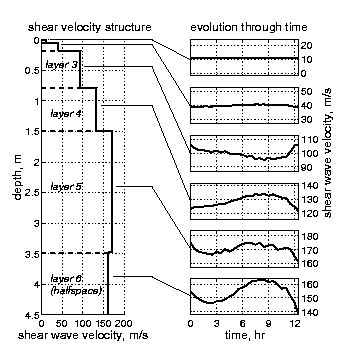
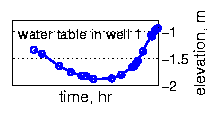
Figure 9
Figure 9. Left: Shear wave velocity structure. Right: Changes in the structure over the tide cycle compared with the water table level. (Postscript Versions: A and B).