Cold season emissions dominate the Arctic Methane budget
December 2015
PAPER:
D. Zona, B. Gioli, R. Commane, J. Lindaas, S. C. Wofsy, C. E. Miller, S. Dinardo, S. Dengel, C. Sweeney, A. Karion, R. Y.-W. Chang, J. Henderson, P. Murphy, J. P. Goodrich, V. Moreaux, A. Liljedahl, J. D. Watts, J. S. Kimball, D. A. Lipson, W. C. Oechel, Cold season emissions dominate the Arctic tundra methane budget, Proceedings of the National Academy of Sciences, 113, 1, 40-45, doi:10.173/pnas.1516017113, 2016 link pdf
DATA:
Zona D., W. Oechel, C. E. Miller, S. J. Dinardo, R. Commane, J. O. W. Lindaas, R. Y.-W. Chang, S. C. Wofsy, C. Sweeney, and A. Karion. 2015. CARVE-ARCSS: Methane Loss from the Arctic - Fluxes from the Alaskan North Slope, 2012-2014. ORNL DAAC, Oak Ridge, TN, USA. http://dx.doi.org/10.3334/ORNLDAAC/1300 link
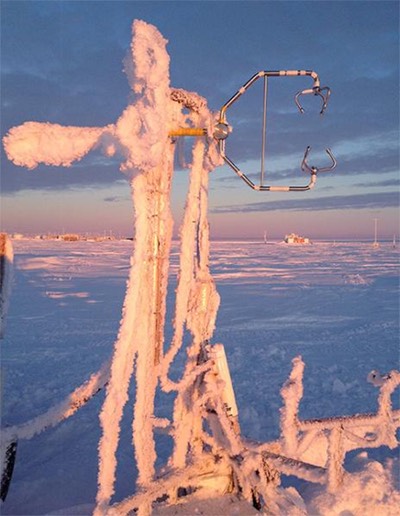
The arctic air temperatures are warming at twice the global average. This warming has an effect on the carbon-rich soils of the arctic. It is estimated that there is as much carbon locked into arctic soils as there is CO2 in the air already. Most models have assumed no biogenic methane emission during the cold winter months. However, Dona Zona (University of Sheffield) and Walt Oechel (San Diego State University) found that emissions during the cold season (Sept-May) contribute ≥50% of annual sources of methane from Alaskan tundra. These emissions were based on fluxes obtained from eddy covariance sites.
When we compared those smaller scale fluxes (~km2) with regional fluxes calculated from aircraft data we found that very similar fluxes were seen across the larger north slope region. The aircraft data were collected during the CARVE (Carbon in the Arctic Reservoirs Vulnerability Experiment) project based out of Fairbanks, AK in 2012-2014 (PI: Charles Miller, JPL, co-I Steve Wofsy, Harvard University). Jakob Lindaas and I (Harvard University) combined the observed methane mixing ratios with the surface influence calculated by John Henderson (AER, Lexington, MA) using WRF-STILT. Steve Wofsy (Harvard University) identified this high methane signal in the global cross-section data collected during the HIPPO (Haiper Pole-to-Pole Observations), highlighting the global impact of these methane emissions.
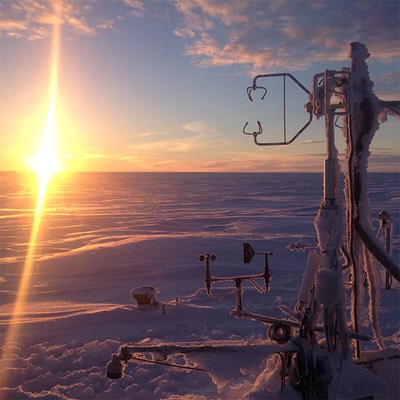
Unexpectedly, the largest methane emissions were observed at the driest eddy flux site (<5% inundation). Emissions of methane in the cold season are linked to the extended “zero curtain” period where soil temperatures are poised near 0oC, indicating that total emissions are very sensitive to soil climate and related factors, such as snow depth.
When we looked at the dependence of the CH4 fluxes on soil temperature, we were surprised to find two very different behaviors depending on how dry the soil was. The wetter soils saw lots of methane released as the soils thawed and warmed up, before the methane emissions declined as the season went on to a low but still significant level before the final full freeze up of the soils. The dry soil site saw a slow increase in methane release through the start of the summer, before peaking late in the season as the soils began to cool again. The soils at the dry site were much warmer than the other sites and the winter-time methane release was also higher.