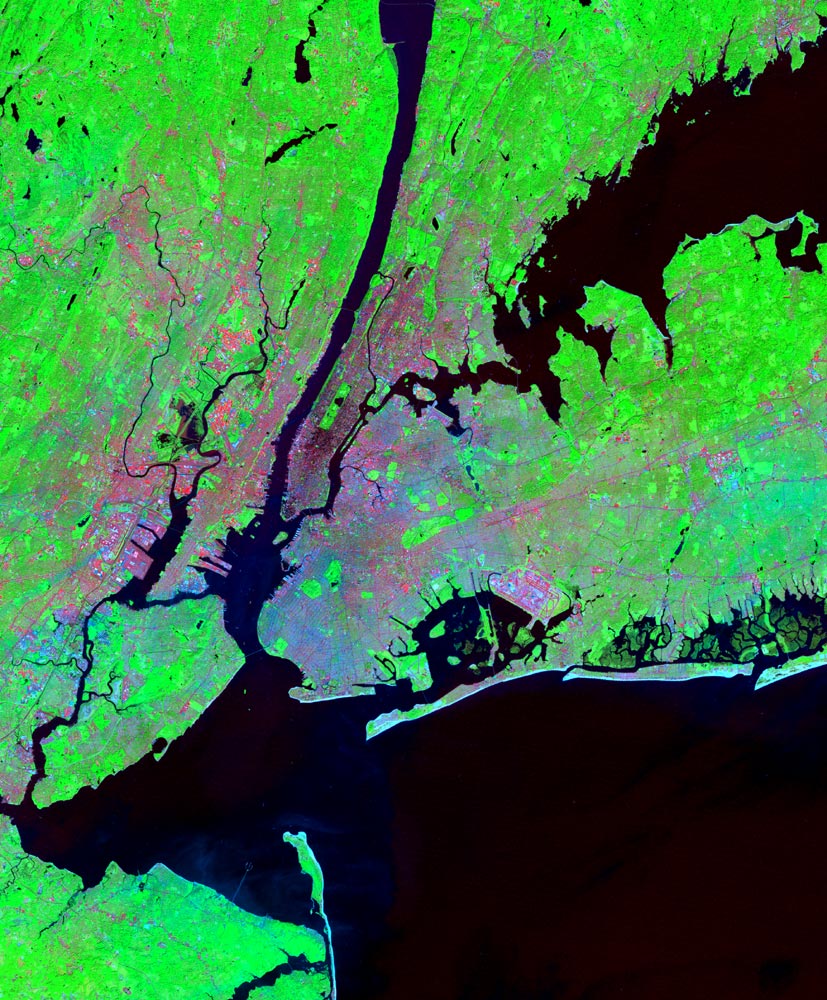
The image above is a false color composite combining surface temperature and vegetation abundance information derived from Landsat TM data acquired 2 October, 1999. Red indicates surface temperature, green indicates vegetation abundance and blue indicates visible brightness. Red and pink areas are characterized by higher surface temperatures and lower vegetation abundances. Green and yellow areas are characterized by higher vegetation abundances and lower surface temperatures. Blue areas have lower surface temperatures and less vegetation. Black areas reflect and emit the lowest amounts of visible and Infrared radiation.
![]()