Often we would like to look at other details about the data set that mbinfo does not provide. MB-System™ provides two tools to both extract and display these statistics, mblist and mbm_xyplot. We should consider a few examples.
While mbinfo provides nice summary statistics, it is frequently useful to look at the nadir beam depth for a data set. Often sonars use the initial bottom detection as a hint for where the sonar might find the bottom in subsequent beams moving out to either side of the ship. Therefore, the quality of nadir beam bottom detects is often of concern. Moreover, linear profiles of the sea floor often show morphological features that are not readily apparent in a 3D plot. Among many other details, mblist can extract the nadir beam depth and mbm_xyplot can create a quick plot for us. Here's how:
For this example, we can use the survey taken aboard the R/V Ewing that was referenced in the "Surveying Your Survey" chapter. The data can be found in mbexample/cookbookexamples/otherdatasets/ew0204survey/
To extract the along track distance in kilometers, and the nadir beam depth in meters, we can execute:
mblist -F-1 -I survey-datalist -OLZ > nadir.dat
Similar to other conventions in MB-System™ the "-1" argument to the format flag (-F) signifies a data list rather than a single file. That datalist is provided - "survey-datalist". The output format is specified by the "-O" flag and any of combination of a series of letters signifying what data to extract and list. In this case, L signifies along track distance in kilometers, and Z signifies "topography" (measured with negative numbers from sea level) in meters. Here are the results:
more nadir.dat
  0.000 -4508.881
  0.000 -4498.527
  0.079 -4473.954
  0.167 -4471.477
  0.253 -4449.490
  0.335 -4422.259
  0.426 -4411.923
...
The plot has been created with gnuplot:
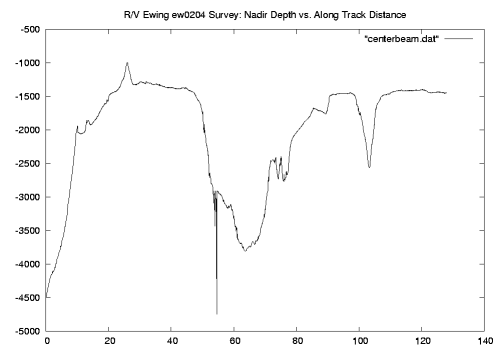
In the plot above we have a nicely scaled profile of the depth directly beneath the ship for the duration of the survey. We see a data-discontinuity near the center - a detail that would be remedied if the survey data has been cleaned up at all prior.
mblist is not limited to just nadir depth. Oh no, mblist can extract many others, among them speed heading, pitch, roll, draft, ping interval, course made good - all for each ping. It can also extract Latitude and Longitude, bathymetry, amplitude, across track distance and grazing angle per beam. It can calculate across track slopes per ping, and can extract and convert time into three formats.
Another interesting example is to create a plot of ping interval vs. nadir depth a sample of sonar data that varies considerably with depth. Well behaving sonars should show a clear relationship between ping interval and bottom depth. When the sonar is operating correctly, it will gate around the bottom in a orderly (typically linear) way. We can generate the data for such a plot with a line like the following:
mblist -F-1 -I survey-datalist -OzV > pinginterval.dat
Then plotting the results:
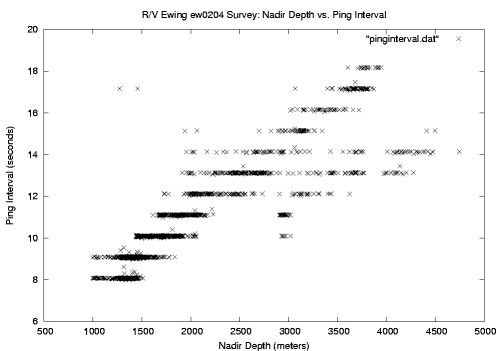
In the plot above, one can quite clearly make out the linear relationship between ping interval and bottom depth. One can also see that ping intervals are adjusted in whole second intervals for this sonar. The plot also seems to show that the automatic gating mechanism adjusts the ping intervals at roughly 250 meter intervals. Considering the amount of data and the 3000 meter (plus) depth changes in this survey, the scatter we see here is not unusual. None-the-less, the data points outside the linear band are a product of the sonar bottom tracking mechanism loosing the bottom for a time. These can be of concern if they increase in number and persist over flat sea floors where one would otherwise expect very regular behavior.