Table of Contents
Extracting and plotting sonar statistics is one one the most helpful tools available to both a sonar engineers and scientists. So much so, that we've decided to tuck an entire chapter dedicated to the topic here in the back. Whether you are trying to discern the amount of noise inherent in your sonar, or how good the coverage is in your survey, MB-System™ has many tools to help.
At the end of the "Surveying your Survey" chapter we saw that mbinfo quickly produces a standard set of statistics about a data set. mbinfo can also provide statistics on a "per beam" rather than a "per file" basis. These statistics include the mean, variance and standard deviation of the bathymetry, sidescan and amplitude data in a given beam over the length of the data file. Actually what is provided by mbinfo is the ability to filter the data set somewhat by specifying a number of pings to average. The resulting data are then used to calculate the mean variance and standard deviation.
Let me try to explain with an example. Suppose you have a data set with just 5 pings of data. One invokes the mean, variance and standard deviation calculations with the -Ppings flag of mbinfo where pings specifies the averaging or filtering interval. If we invoke mbinfo -F183 -I datafile -P3, for the first beam, averages will be calculated for pings 1,2 and 3; then averages for pings 2,3 and 4; and finally averages for pings 3,4 and 5. For the first beam, instead of the 5 original data points, we now have 3 data points which are the results of our filtering. The mean, variance, and standard deviation of these 3 points are then calculated and reported by mbinfo.
Below mbinfo is executed on a piece of data used elsewhere in the cookbook for roll bias calculations with these statistics calculations turned on. Below the normal mbinfo data are the "Beam Bathymetry Variances". A subset of the results are shown.
mbinfo -F183 -I other_data_sets/rollbias/compositefirsttrack.mb183 -P3
...
Beam Bathymetry Variances:
Pings Averaged: 3
 Beam     N      Mean     Variance    Sigma
 ----     -      ----     --------    -----
   0      0       0.00       0.00      0.00
   1     18    5495.23   14800.32    121.66
   2     36    5566.27    5284.35     72.69
   3     36    5616.40    2704.20     52.00
   4     36    5630.93     552.92     23.51
   5     36    5672.55     268.41     16.38
   6     36    5673.54      75.28      8.68
   7     36    5674.83     155.70     12.48
   8     36    5676.09      62.31      7.89
   9     36    5682.15      58.47      7.65
 ...
Calculating these statistics over a flat piece of sea floor provides a quick way to assess the noisiness of a sonar array. Noise is heavily depth dependent, therefore, in order to compare this data with other data sets taken in different depths of water, we can divide our standard deviation values by the average water depth to get something akin to percent error. Over a flat bottom, one would expect the standard deviation of the data in each beam to be quite small.
Not shown here, we have manually extracted the bathymetric standard deviation data output by mbinfo above. We then loaded into a favorite math program, divided the standard deviation data by a the nominal water depth for the file, and plotted the results.
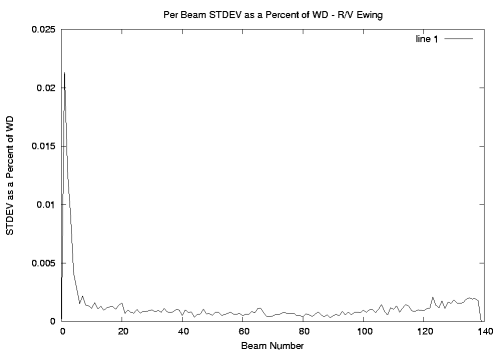
Here we see that the sonar has a noise level that creates a standard deviation of depth errors of far less than 2% of the water depth. We also see some problems in the outer beams of the port side - perhaps something to investigate. Noise of this kind can be caused by several factors, including own-ship noise, sea state, and electronic interference of various kinds.