next up previous contents
Next: RESULTS AND DISCUSSION Up: M2001_REP Previous: VARIUOS


DATA ACQUISITION

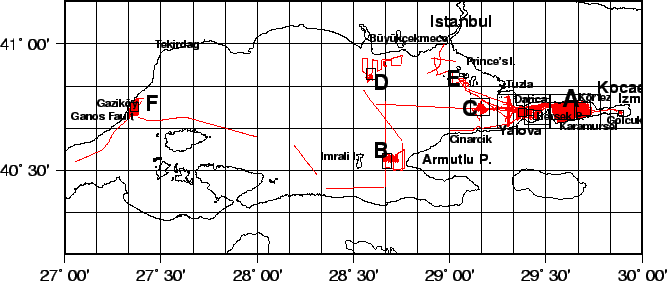
Fig.32 shows the pattern of the multibeam and SBP lines that were run during the 19 days of operation in the area, up to a total mileage of roughly 2250 KM. Figures 45 to 58 in Appendix 8 give details of the investigated areas, including the coring, CTD and ROV stations.

Figure 32: Work Areas and Multibeam,SBP track lines.
\begin{figure}\centerline{\epsfig{bbllx=20,bblly=30,bburx=520,bbury=300,
file=PS/M2001_NAV_MARMARA.ps,width=15cm}} \end{figure}


2001-07-13