Story line for the B2C ground water exhibit
Martin Stute - 7/09/2002
Barnard College, Lamont-Doherty Earth Observatory
of Columbia University
martins@ldeo.columbia.edu
Our exhibit has three modules focussed on (1)
the hydrologic cycle, (2) contaminant transport, and (3) water issues
in
the Tucson Basin. We like to get across the following concepts:
-
water cycle
-
ground water flow, recharge/discharge, ground
water/surface
water interactions, flow through sediments and fractured rocks
-
ground water contaminant transport
-
water quanity and quality issues in the
Tucson Basin
We plan to use the exhibit with a trained
operator:
-
in undergraduate and graduate courses at B2C,
-
in B2C highschool summer programs,
-
as part of the regular B2C tourist tour,
several
scheduled 'performances' per day.
View of the exhibit from the top:
-
Lights are suspended from the ceiling to
illuminate
the exhibit, in particular the two sand boxes.
-
A timer periodically produces rain and
injects dye
into the landfill area in the 3D and 2D models
-
The relative arrangement of the three
elements is
subject to the geometry of the exhibit space. The big sand box needs to
be viewed from the lower right corner.
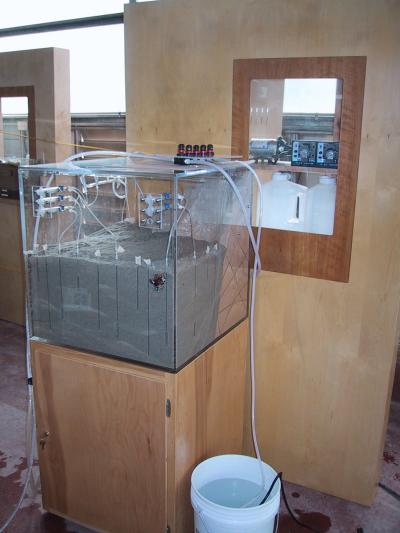
-
View of the sandbox and cabinet with
installed pumps
during construction phase low
res
image
Module 1: The water cycle (right)
(pdf file of Module 1)
Key points:
-
water cycle, global water budget
-
ground water flows from high to low elevation
-
ground water/surface water interaction
-
recharge/discharge
Header: 1. The water cycle
Text:
All water on Earth participates in the water or 'hydrologic' cycle.
In the Tucson area, most precipitation falls in the mountains as
rain
and snow, about 1000 mm (40 inches)/year on Mt. Lemmon versus 300 mm
(12
inches)/year in downtown Tucson. Most of this water either
evaporates
immediately or runs off on the surface into rivers and lakes. Water
enters
the ground (infiltrates) mostly through fractures in the mountains and
through coarse sediments underneath the stream beds. Ground water, like
surface water, flows basically from high to low elevation. However,
because
ground water flows a lot slower than surface water, ground water in the
Tucson Basin can be up to several thousand years old, and may have
formed
under different climate conditions.
Figures:
-
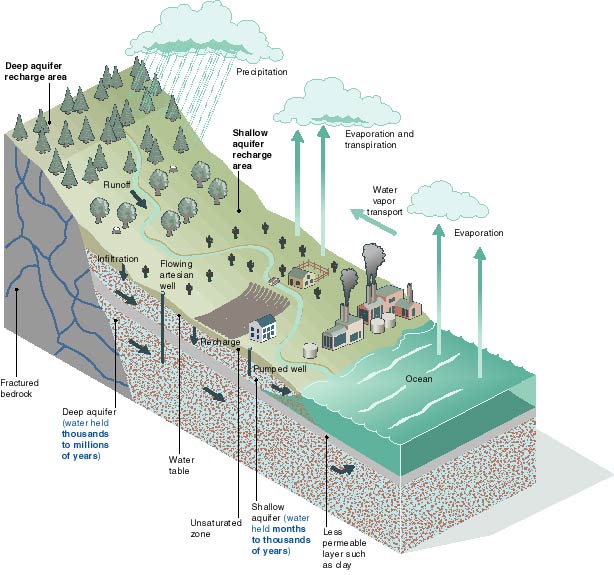
Fig 1.1 Global water cycle
-
(low res image, jpg)(high
res images, AI)
-
Source: M. Stute, Lamont-Doherty Earth Observatory, 2002
-
Caption: Water evaporating over the
oceans
is transported by wind, condenses to form clouds, and falls to Earth as
rain or snow. Most of it immediately returns to the atmosphere by
evaporation
or transpiration (loss of water from plants). Part of it runs off on
the
surface and forms lakes and rivers. The remainder soaks into the
ground,
some of which recharges aquifers (permeable geological formations that
produce water) and becomes ground water. Surface water and ground
water eventually flow into the ocean or evaporate/transpire back into
the
atmosphere to complete the water cycle.
-
Fig 1.2 Global water budget
-
(low res image)(MS
Excel file)
-
Source: after Berner and Berner, 1987
-
Caption: Only very little of the Earth's water is
available for
our use. More than 97% of the water on our planet is in the oceans and
is too salty for consumption. Less than 1% of all water on Earth
is available to support life on land.
-
Fig 1.3 Gaining and losing streams
-
(low res image)(high
res image, Illustrator)
-
Source: after Winter et al., USGS Circular 1139, 1998
Caption: Surface and ground water are often connected, and
water
can flow in either direction depending on the elevation of the stream
or
lake relative to the water table in the aquifer. Lowering of the water
table by over-pumping or drought may result in stream beds drying
up, causing the subsequent death of vegetation and animals. Artificial
recharge through stream channels can raise ground water levels. The
water
table is the level to which water rises in a shallow well in the
uppermost
aquifer.
Module 2: Ground water contamination (middle)
(pdf file of Module 2)
Key points:
-
typical sources of contaminants
-
typical contaminants
-
migration of contaminants in the subsurface
can be
very complicated
-
pumping might influence the movement
-
despite the fact that clean-up technologies
are available,
prevention is the most important strategy
Header: 2. Ground water contamination
Text:
Groundwater naturally contains many dissolved
elements,
most of which do not pose a danger to plants or animals. However,
harmful
substances that we discharge, spill, or bury may soak into the ground
and
result in ground water contamination. Although there are many clean-up
technologies available, it is often very difficult to remove
contaminants
after they have entered the aquifer. Prevention is the most important
strategy.
Researchers
at Columbia University, the University of Arizona and many other
institutions
study contaminant transport processes and help develop management
strategies.
Figures:
-
Fig 2.1 Typical sources of ground water contaminants
-
(low res image)(Adobe
Illustrator file)
-
Source: after Hemond & Fechner-Levy, 2000
-
Caption: Groundwater is vulnerable to contamination from
leaking
landfills and fuel tanks, discharge from industrial plants, septic
tanks,
and from agricultural activities, just to name a few. Some of these
contaminants
dissolve in water. Others do not dissolve well and float on top of the
aquifer or sink to the bottom. The migration of contaminants is
influenced
by their chemical properties, the geology of the aquifer and also by
how
much water is pumped out of the aquifer.
-
Fig 2.2 Contaminant plumes at the Broadway/Pantano landfill site
-
(low res image) (Abobe
Illustrator file)
-
Source: Arizona
Department of Environmental Quality, 2002
Caption: This municipal landfill is located in east-central
Tucson and was operated until 1971. In 1987, tetrachloroethene (PCE)
was
detected in a city well located at the western edge of the
landfill.
Since then trichloroethene (TCE), and vinyl chloride have also been
found
in ground water at levels exceeding regulatory standards. The city of
Tucson
Water Department (Tucson Water) has lost the use of four municipal
wells
in its Central Wellfield as a result of the contamination. The
contaminants
have reached the water table by vapor transport through the unsaturated
soil. A soil vapor and ground water containment system will be
operational
at the landfill in 2002. The map shows the extent of the PCE
contamination
plumes where the concentrations exceed the regulatory standards (5
micrograms/liter
(µg/l)).
Module 3: Tucson basin (left)
Key points:
-
unbalanced water budget
-
consequences of water mining, in particular
subsidence
-
past, present & future
-
drying of rivers as consequence of drop in
water
table
(pdf file of Module 3)
Header: Water in the Tucson Basin
Text:
Most of the water used in the city of Tucson comes from ground water.
Currently,
only a third of this water is replaced each year by natural recharge.
That
means we are depleting our aquifer at unsustainable rates. If this
trend
continues, the regional aquifer will become increasingly compacted,
land
surface in certain areas will continue subsiding, and plant and animal
life will continue to decline. The City of Tucson Water
Department
(Tucson Water) is currently reducing the withdrawal of ground water in
central Tucson by artificially recharging the aquifer with renewable
Colorado
River water (CAP, Central Arizona Project). All available water
resources
(ground water, CAP water, reclaimed water) and further conservation
measures
will be needed to meet rising demands in the near future. Long-term
rapid
population growth in the Tucson Basin will result in even more pressure
on both the quantity and quality of available water resources and it
will
be increasingly difficult to balance our water budget!
Figures:
-
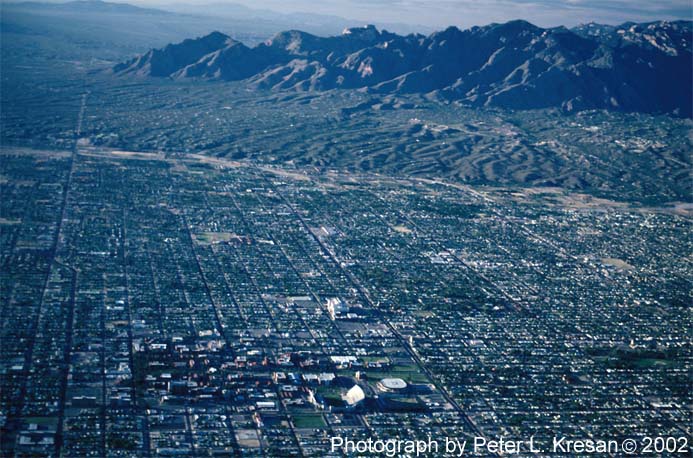
Fig 3.1 Aerial view of the northern section of the Tucson Basin
reflected
in the sand tank model
-
pictures would be placed above the sandtank model to show what the
model
corresponds to in the real world.
-
low res image, (high
res image, TIF)
-
please make sure that the copyright as shown on the low res image goes
on the high res as well.
-
Source: P. Kresan, University of Arizona, 2002
-
Caption: Aerial view of the northern section of the
Tucson Basin
reflected in the sand tank model.
-
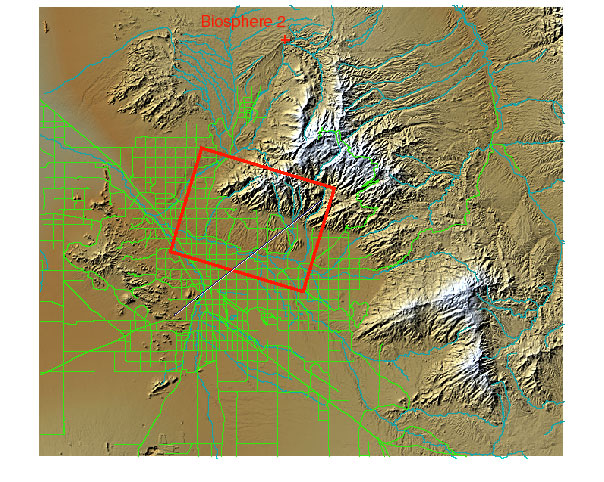
Fig 3.2 The Tucson Basin from above and location of the sand
tank model
-
low res image, high
res image
-
Source: R. Butler and M. Wallace, The Saguaro Project,
University
of Arizona, 2002
-
Caption: The Tucson Basin from above, and location of the
sand tank
model (red box), and the geological cross section in Fig 3.3 (blue
line).
-
Fig 3.3 Schematic vertical cross section through the Tucson Basin
-
low res image (high
res simage, Illustrator file)
-
Source: B. Scarborough, Desert Museum, 2002
-
Caption: The Tucson Basin is like a
large
bathtub filled with sediments surrounded by mountains. The basin
aquifers
are recharged mostly by water coming from the mountains, where it rains
more than in the valley. In general, water quality decreases in the
older
and deeper sediments.
-
Fig 3.4 Approximate decline in ground water levels , 1940-1995
-
low res image,
high
res image
-
Source:
Water Resources Research Center, University of Arizona, 1999;
Tucson
Water, 2002
-
figure would be combined with one hydrograph as an example (well
C-033A),
in center of depression cone (see black star in -200ft zone in
low
re image) low res image (Excel
data file)
-
Caption: The water table in Tucson has steadily declined
over the
last 50 years as shown here for one Tucson Water well. In some
places
the water table has fallen by more than 60 m (200 feet). As the aquifer
loses water, it becomes compacted and the land surface subsides.Stream
beds run dry and cannot support plant and animal life.
Additional potential figures
-
Fig 3.x Water Demand and Supply in the
Tucson
AMA (1997 conditions)
Should contact ADWR for updated information.
-
Fig 3.x The growth of the City of Tucson
-
Fig. 3.x Ground water table and flow
direction
in Tucson
-
Fig 3.x Movement of recharged water
through the
aquifer
-
Fig 3.x View of the sandbox and cabinet
with installed
pumps
-
precipitation distribution
-
ground water flow pattern
-
cube with cross section of the box, 3D
-
illustrated with historical photographs
-
growth of Tucson (fig 2-4, WRRC99)
-
lowered water tables for cube area
-
map of lowered water table in whole area
-
future scenarios, budgets incl. CAP water
Kate, this has to go somewhere, not too small:
-
website will provide the following
-
motivation why this exhibit is at the
Biosphere
-
details of the construction
-
links to key publications
-
links to major sites focussed on the Tucson
Water
sistuation
-
links to sponsors (EMSI, SAHRA, Tucson
Water, etc.)
Acknowledgements
This exhibit was made possible with financial support from the National
Science Foundation through EMSI (Environmental Molecular Science
Institute,
Columbia University) and SAHRA (Sustainability of semi-Arid
Hydrology
and Riparian Areas, University of Arizona) Logos: EMSI
SAHRA
We also like to thank the following individuals for their support of
this project:
-
M. Basefsky, Tucson Water
-
A. Borden, undergraduate student, B2C
-
R. Butler, University of Arizona
-
P. Catanzaro, Columbia University
-
L. Ehman, Arizona Department of Environmental Quality
-
B. Ekwurzel, University of Arizona
-
G. Flynn, Columbia Universiy
-
L. Key, Environmental Education Exchange
-
R. Marra, Tucson Water
-
B. Prior, Tucson Water
-
D. Rucker, University of Arizona
-
B. Scarborough, Desert Museum
-
E. Spangenberg, University of Wisconsin
-
S. Pfirman, Barnard College
-
C. Stute
-
M. Stute, Barnard College and B2C
-
B. Tellman, Water Resources Research Center, UofA
-
G. Wagenseller, Arizona Department of Environmental Quality
-
M. Wallace, University of Arizona
-
J. Washburne, UofA
-
and many others.