October 18, 2011
The Day - October 18, 2011 started out cloudy and windy but cleared by noon. Weather is important to record as the chlorophyll molecule absorbs sunlight, using this energy to build carbohydrates. This means that bright sun levels are linked to increased algal and phytoplankton production, and it is this productivity that we are measuring with our chlorophyll a sampling.
Methods - The sampling methods are described in the main chlorophyll page. Note in our 2011 data:
Units: 2011 results are listed in ug/L yet 2005 results are listed in mg/m3. How does the unit 'ug/L' compare to 'mg/m3' Micrograms/liter (ug/L) are the same as milligrams/cubic meter (mg/m3) and are completely interchange.
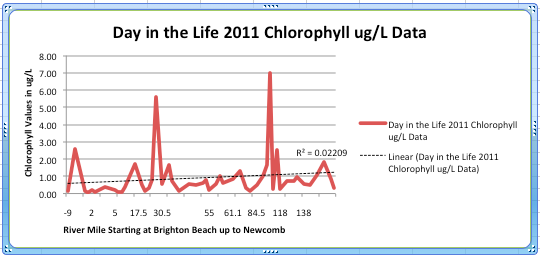
Examining trends in the data. A trend line is a straight line used to connect multiple points in the data or the best fit connecting the data. The steepness of the trend in the data indicates the strength of the trend, the flatter the line the lower the strength of the trend. Once a trend line has been established an R2 value is used to see how well the line fits the data, in other words is there a consistent relationship between the two variables being plotted on the graph (in our case this is chlorophyll and RMs)? A perfect match would be a value of 1.0, a strong relationship would be 1.0-0.7, and a moderate linear relationship would have values between 0.7 and 0.4. Our value of 0.022 falls very low suggesting that there is not a strong relationship between river mile and chlorophyll. This means we would not want to make predictions on chlorophyll levels in the river just using river miles.
Results for the 2011 samples show four areas in the estuary where there were spikes in chlorophyll productivity. Canarsie Pier in Jamaca Bay, Memorial Beach in Nyack, Ulster Landing Park in Saugerties and Cohotate Preserve in Athens had chlorophyll levels that reached higher than 2.0 ug/L. However, looking at the overall chlorophyll sample data plotted by River Mile (RM) the readings were relatively low with a dozen sites falling below 0.3 ug/L.
Below is a chart of those sections of the river with the highest and the lowest Chlorophyll readings.
| Chlorophyll Readings > 2.0 ug/L | Chlorophyll Readings < 0.3 ug/L | |||||||
| Location | RM | ug/L | 5 highest | Location | RM | ug/L | 8 lowest | |
| Canarsie Pier | -6.5 | 2.56 | This year the highest levels of chlorophyll from our sample locations was represented by levels over 2.0 ug/L. They included only the four sites listed to the left. | Brighton Beach | -9 | 0.14 | This year the lowest levels of chlorophyll from our sample locations was represented by levels below 0.3 ug/L. They include the dozen sites listed to the left. | |
| Memorial Beach, Nyack | 28 | 5.62 | Valentino Pier, Brooklyn | -2 | 0.17 | |||
| Ulster Landing, Saugerties | 97 | 7.02 | Governor's Island, Upper Bay |
-1 | 0.06 | |||
| Cohotate, Athens | 115 | 2.51 | HRPT Pier 40 | 2 | 0.21 | |||
| HRPT Pier 45 | 2.5 | 0.09 | ||||||
| HRPT Pier 95 | 5 | 0.18 | ||||||
| GW Bridge | 12 | 0.12 | ||||||
| Englewood Boat Basin | 13 | 0.07 | ||||||
| Alpine Boat Basin | 18.5 | 0.13 | ||||||
| Croton Point Park | 35 | 0.15 | ||||||
| Cold Springs | 55 | 0.22 | ||||||
| Quiet Cove Poughkeepsie | 78 | 0.16 | ||||||
| Saugerties Light House | 102 | 0.27 | ||||||
| Hudson Waterfront | 118 | 0.25 | ||||||
What are some of the parameters that can impact chlorophyll levels in the river?