October 4, 2012
The Day - October 4, 2012 was a wet and overcast day, although most of the participating groups sampled before strong rains hit the area. Weather is important to record as the chlorophyll molecule absorbs sunlight, using this energy to build carbohydrates. This means that bright sun levels are linked to increased algal and phytoplankton production, and it is this productivity that we are measuring with our chlorophyll a sampling.
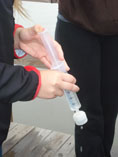
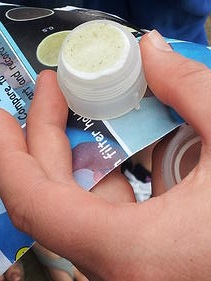
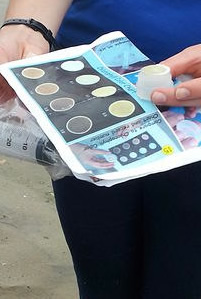
Methods - The sampling methods are described in the main chlorophyll page. Note in our 2012 data:
Units: 2012 results are listed in ug/L and 2005 results are listed in mg/m3. How does the unit 'ug/L' compare to 'mg/m3' Micrograms/liter (ug/L) are the same as milligrams/cubic meter (mg/m3) and are completely interchange.
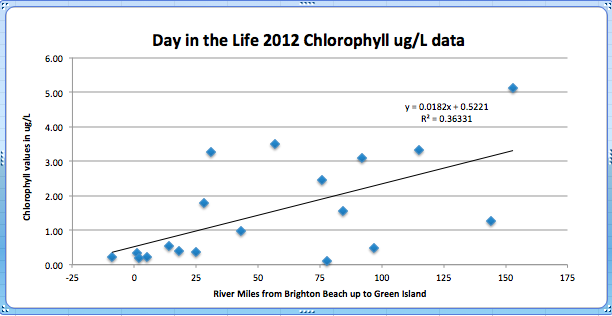
Results for the 2012 sample show that the southern end of the estuary, from Brighton Beach at RM -9 up through Piermont Pier at RM 25, had consistently low chlorophyll levels compared to the rest of the estuary. However, looking at the overall chlorophyll data plotted by River Mile (RM) there seems to be a high degree of variability in the chlorophyll results. Putting a trend line through the data to examine chlorophyll as a function of RM will help with our analysis.
Examining trends in the data. A trend line is a straight line used to connect multiple points in the data or the best fit connecting the data. The steepness of the trend in the data indicates the strength of the trend, the flatter the line the lower the strength of the trend. Once a trend line has been established an R2 value is used to see how well the line fits the data, in other words is there a consistent relationship between the two variables being plotted on the graph (in our case this is chlorophyll and RMs)? A perfect match would be a value of 1.0, a strong relationship would be 1.0-0.7, and a moderate linear relationship would have values between 0.7 and 0.4. Our value of 0.36 falls below even a moderate relationship, suggesting that there is not a strong relationship between river mile and chlorophyll. This means we would not want to make predictions on chlorophyll levels in the river just using river miles.
Below is a chart of those sections of the river with the highest and the lowest Chlorophyll readings. Note that Cohotate in Athens, NY has recorded one of the higher readings for chlorophyll each year of our posted results. Also note that in 2011 Ulster Landing Park recorded one of the highest readings, but this year it has one of the lowest readings.
| Chlorophyll Readings > 3.0 ug/L | Chlorophyll Readings < 0.5 ug/L | |||||||
| Location | RM | ug/L | 5 highest | Location | RM | ug/L | 8 lowest | |
| Hook Mt., Nyack | 31 | 3.27 | The highest levels of chlorophyll (levels over 3.0 ug/L) from our sample locations included the sites listed on the left. | Brighton Beach | -9 | 0.22 | The lowest levels of chlorophyll (levels below 0.5 ug/L) from our sample locations include the sites listed on the left. | |
| Riverfront, Peekskill | 43 | 3.49 | Brooklyn Bridge Pk. | 1 | 0.35 | |||
| Kingston Pt. Park | 92 | 3.08 | Pier 40 | 2 | 0.20 | |||
| Cohotate, Athens | 115 | 3.32 | Pier 95 | 5 | 0.21 | |||
| Green Island, GI | 153 | 5.11 | Beczak, Yonkers | 18 | 0.38 | |||
| Piermont Pier | 25 | 0.37 | ||||||
| Quiet Cove, POK | 78 | 0.11 | ||||||
| Ulster Landing Park | 97 | 0.47 | ||||||
What are some of the parameters that can impact chlorophyll levels in the river?