 |
 |
 |
|
|---|
Polar Curriculum & Outreach Ideas
![]()
Home
Associated Polar Science Projects:
Lamont-Doherty Earth Observatory
POLAR I.C.E. Interactive Climate Education: Curriculum & Education Activities
These activities have been developed through a series of research and outreach initiatives that are ongoing. Each activity has been tested through teacher workshops, classroom work or community events. Activities focus on the evidence of climate change in the polar regions merging background science, real field data, graphics from research publications, and short labs, introducing students to a variety of science concepts and resources. Please check back regularly for new updates! Activities are primarily uploaded as pdfs but often have supporting ppts. If you have any questions please contact Margie Turrin.
ACTIVITY: |
TEACHERS | STUDENTS |
| ICE SHEETS : | ||
BERGY BITS: 2 MINUTE VIDEO - making glacier goo!
|
Simple Ice Sheet Physics: A series of short experiments that explore basic physics concepts around glacier behavior. Activities can be done individually or as a full set with students rotating to test different physics concepts. Each short experiment ending with analysis and connection to glaciers in the real world. Works for any age student. Full set of activities & supplies list |
Student glacier activities in pdf version. Activities work for Earth Science, Introduction to glaciers, developing observational skills for younger students etc. For a few facts about glaciers check out "Glacier Basics!" 2 MINUTE VIDEO - making glacier goo!
|
BITS & BYTES OF ICEPOD SCIENCE
|
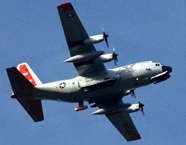
An introduction to IcePod! Introduction to IcePod Science is a background piece about this fascinating pod full of instruments. IcePod Contours uses an ice contouring activity to calculate a rough ice volume for Greenland. Radar uses real IcePod data to explore some new science questions about ice freezing onto the base of the ice sheet. |
An Introduction to IcePod Science - learn all about IcePod, a fascinating pod full of instruments that hitchhikes a ride on the outside of the LC130 plane! IcePod Contours Use ice contours to check out the ice volume for Greenland. Radar use real IcePod data to explore some new science questions about ice freezing onto the base of the ice sheet that have scientists puzzled. |
4 SEA LEVEL RISE ACTIVITIES TO TRY!
|
M.S. -Engagement Activities or E.S. - Interactive Introduction
|
|
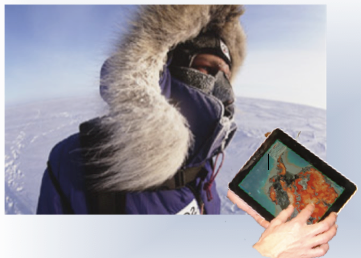
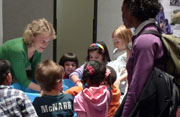
LET'S TALK STEM CAREERS!
|
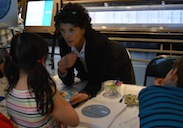
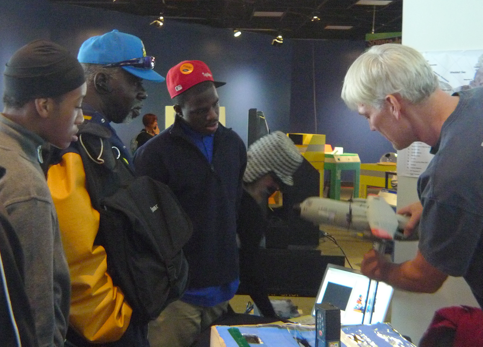
STEM Career Activity - Web Look at Activity -Click on images of any team member working in the field. for a links to their individual career write up. Or select the full packet as one link. Self contained, single class activity. Great for a substitute teacher activity!
|
Web Look at Activity -The icePod Project Team uses Science, Technology, Engineering and Math (STEM) daily. This activity focuses on their different careers and the STEM skills each uses in performing of their jobs.
|
| CLIMATE ACTIVITIES | ||
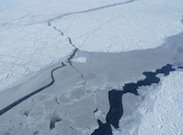
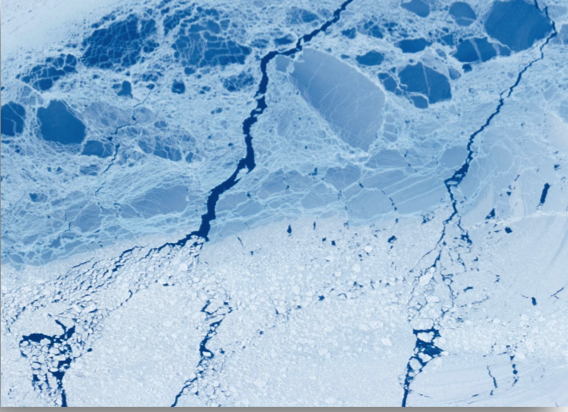
PUZZLING OVER ARCTIC SEA ICE
|
Arctic Sea Ice - Explore the role of Arctic sea ice in our warming world. This activity includes an Arctic Map (this can be ordered as a puzzle - download the map and use to order a 20 x 28 inch, 48+ piece puzzle available from a variety of online custom puzzle shops.). The template for the Arctic sea ice. The supporting slides as a pdf. full activity is here. Response form for students. Teacher ppt. The commitment sheet for capturing the student's thoughts. Part of the activity uses the NASA filmclip for background. The filling needs article looks at young people taking action. | Learn about the role of Arctic Sea Ice and make a commitment to create change. Students will need the Arctic Map (or puzzle) and sea ice template, the full activity here. You will need the response form for students to work on. NASA filmclip provides great context for the activity. The commitment sheet is for capturing the student's willingness to create change. The filling needs article is an example of what a young person has taken on to focus on solutions. |
| SEA LEVEL ACTIVITIES | ||
POLAR EXPLORER: SEA LEVEL - explore the drivers and impacts of sea level rise
|
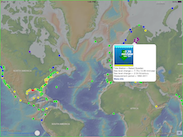
Sea Level App - Download our free iOS app that uses data to explore the many factors that drive sea level change. OR our web-based version. Explore what it was like in the past and who might be affected the most by changes in sea level today and into the future. Try our Climate Investigations (pdf teacher version -but for full explanations download the pptx) or one of our 3 science quests! A science quest is a storyline that leads the user through a series of maps that highlight a specific science concept. |
Download our "Polar Explorer: Sea Level" app or open the web-based version to explore the many factors that impact changes in sea level. Then user our science interactives to examine science concepts and processes. Try our 'Investigations & Quests' to locate some of the stories in the data maps.
|
SINGLE INTERACTIVES
|
Try our Sea Level interactives each with a different Sea Level rise focus:
|
The activity can be used on an ipad or iphone or directly online. The actual swiping with your hands on the ipad or phone makes these much more interactive. Try one or all of them. Each is designed to build an enhanced understanding of how ice/oceans and land interact in different climatic situations in the Earth system. Use the links in the 'Teacher' section to get started. |
MEASURING CHANGING SEA LEVEL
|
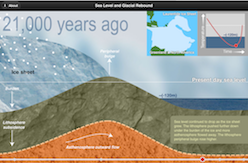
Changes in Sea Level - This activity is based on real data. Map based data visualizations, graphs & charts introduce students to current sea level & in Earth's history. For the pdf or ppt and for the Annotated Teacher Version of the Student Activity with teaching notes and anticipated student responses. A background piece on the polar regions are their role in studying climate change and predicting future sea level rise. |
Sea Level has changed throughout Earth's history as water from the oceans freezes into ice sheets during Earth's cold periods, then melting back to into the oceans during warmer periods. Scientists collect Earth measurements to examine climate & sea level in the past, present and to predict the future.
|
SEA LEVEL RISE: A FIELD ACTIVITY
|
Sea Level Rise: A Field Activity: Designed to be done along a coastline of an estuary and ocean waterfront this field based activity steps from current sea level to future predictions. Future predictions are based on the International Panel on Climate Change (IPCC) estimatess. Activities are mapped to NGSS. Full activity & supplies list. Note: The packet includes the New York City tide gage but you can find the closest tide gage to your area for using this activity in other lcoations. |
The student packet is folded into the full pdf and starts on page #13. Students will do their own predictions of sea level in their communities and will then collect field measurements and then graph these to see the physical 'reach' of future sea level rise. Students can then match their graphing into a larger dataset with other students who measure in a different location on the waterfront, highlighting that there are differences in the impacts even in areas that are very close in location. |
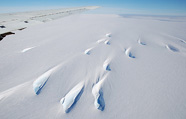
| ANTARCTIC ICE SHELF ACTIVITIES | ||
ACTIVITY 1 - THE ROLE OF ANTARCTIC ICE IN GLOBAL CLIMATE
|
Antarctic Ice #1 This set of three activities examines the role of ice shelves in Antarctica and the wide earth climate system. Activity 1 is an interactive introduction to the Antarctic ice system. The ice pieces in this activity should be printed and made into 4 cards. Each group of students gets a set of cards, an Antarctic map and the activity to work on as a team. Prior to starting review the background information as a class and then have the students work in teams. |
This activity is an interactive introduction to the Antarctic ice system.
|
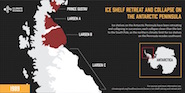
ACTIVITY 2 - THE FATE OF THE LARSEN ICE SHELVES
|
Antarctic Ice #2 This set of three activities examines the role of ice shelves in Antarctica and the wide earth climate system. Activity 2 looks at the set of Larsen Ice Shelves and the role ice shelves play in land ice stability. There is a pptx or a pdf you can use to review the background with the students prior to them working on their activity. |
This activity looks at the set of Larsen Ice Shelves and the role ice shelves play in land ice stability. |
ACTIVITY 3 - DECODING THE MYSTERIES OF THE ROSS ICE SHELF
|
Antarctic Ice #3 This set of three activities examines the role of ice shelves in Antarctica and the wide earth climate system. Activity 3 focuses on Antartica's largest ice shelf, the Ross. Situated between West and East Anatarctica this ice shelf is in a critical location for ice stabilty. There is a pptx or a pdf you can use to review the background with the students prior to them working on the activity. Additionally the students will need a set of radar images of the ice shelf and these two models RCP2.6 RCP8.5 from DeConto and Pollard from Nature publication. |
Activity 3 focuses on Antartica's largest ice shelf, the Ross. Situated between West and East Anatarctica this ice shelf is in a critical location for ice stabilty. Here is the activity and the set of radar images of the ice shelf that you will be using for your ice movement calculations. Additionally these two models RCP2.6 RCP8.5 from DeConto and Pollard from Nature publication will be used to look at future predictions. |
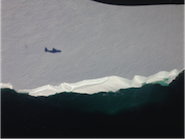
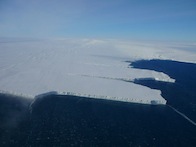
PINE ISLAND GLACIER A 'CLIMATE CANARY'?
Pine Island Ice Shelf - a critical piece of the equation. |
Teacher Activities Set Activity uses real NASA ICESat data to measure glacier change. Students examine the effect of a warming ocean and the role of ice shelves in ocean terminating glaciers. Includes engagement activity, background ppt, worksheet and 2 labs that test hypotheses and gather measurements on glacier processes. Teacher Set - Fully Annotated Teacher Version with teaching notes and anticipated student responses. Lab 1 and Lab 2 with teacher notes. Teacher pdf of ppt and a copy of the glacier grid for the lab set up. |
Complete set of all student activity pieces -
|
SUPPLEMENTARY INFORMATION: PINE ISLAND GLACIER
|
Supplementary Files: For examining a full set of data from transect 279 OR for running a comparison with a second transect 362. Full data sets are provided. Full PIG Data File 279 (excel file) & Full PIG Data File 362 (excel file) for graphing (>600 data pts.)
|
Breakdown by grade: Elementary: For 3rd- 5th grades the Engagement Activity can be used as a stand alone piece to introduce glacier movement. Middle School (MS):Start with Engagement Activity, then match the pptx* ppt* with the fast facts to introduce the science & chart the IceSat data. Next do Lab 1 on observations. Doing Lab 2 has a math focus and will depend on your student group. High School: This group can do it all or start with pptx* ppt*and do the Student Activity, Lab 1 and Lab 2. |
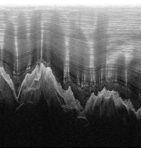
REMOTE SENSING
|
Best Used For Upper Level Middle School & High School Data Files for 3D graphic (xls) or (xlsx). Paper for hand graphing.
|
Using Radar to look through the ice - It is hard to believe that melting ice from Greenland and Antarctica could affect sea levels around the world, but increasing amounts of polar ice are sliding from land into the world's oceans. Knowing what is under the ice helps scientists predict how glaciers will move. How do we look under the ice?
|
UPPER LEVEL DATA
|
Upper Level High School & Undergraduate Note: This activity requires experience working with large datasets in excel |
Impacts of Climate on Pine Island Glacier - Is this Antarctic Glacier Losing Height? In this activity High School or Undergraduate students will analyze authentic ice sheet elevation data from the Pine Island Glacier (PIG) and then develop ‘hands-on’ models to support their hypothesis for the ice sheet behavior. (being modified) PIG Data File 279 (excel file) - PIG Data File 362 (excel file) - Glacier Goo |
PROJECT |
IPY AGAP Antarctic Project | Activities developed as part of IPY polar education including using remote sensing data to travel through Antarctica, journey to the bottom of the Earth with two young scientists & exploring the impact of climate change on the ice sheets. |
VISUALIZING DATA
|
Elementary - Directed Middle Student - Teams of two High School - Independent Work *Using Satellite Data in Education- the strength of data exploration * Teacher version of the Activity (pdf) with answers & detail on age appropriate exploration
|
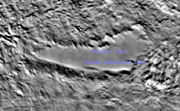
Visualizing Data - Antarctic Radar Data to identify features & locate subglacial lakes - Navigating the data set (also needed) Computer Lab - The use of remote sensing data is used extensively in understanding our planet. This activity introduces students to the Mosaic of Antarctica data set of satellite images collected by the MODIS instrument (Moderate-Resolution Imaging Spectroradiometer) http://planet.sr.unh.edu/MOA/ |
MIDDLE SCHOOL SCIENCE INTERACTIVE
|
Middle School - 6th through 8th This is a complete set of activities covering a wide range of topics including: Subglacial lakes, thickness of the ice sheet, sea level rise, field based sciences. |
Adrienne and Beth's Wild and Crazy Adventure at the Bottom of the Earth! Follow Adrienne and Beth on their journey to the most remote place on Earth and see if you can help them solve the many puzzles that they face while they are there! Students apply science and math concepts while they join these young scientists in an interactive web based adventure. |
HOW MUCH ICE IS IN THE ICE SHEETS?
|
Can Be Used With All Ages |
Climate Change: Why do the Poles Matter?...water, water, water. There are 3 big ice sheets on Earth: Greenland, West Antarctica, East Antarctica. If they melted entirely sea level everywhere would rise. Each ice sheet holds the following amounts of sea level rise trapped in ice: Greenland 24 feet; West Antarctic 19 feet; East Antarctica 170. This is a total of 213 feet of sea level rise all over the world! But what does this really mean? |
PROJECT |
IPY Polar Weekends Project | Hands on science exploration of shrinking Arctic sea ice, mountains hidden under the ice, use an ice core to travel through history, effects of rising sea level, explore Antarctica's dry valleys, lakes and water that moves under the ice! |
POLAR WEEKEND INTERACTIVE SCIENCE
|
Middle School to High School | Polar Weekend Activities - A series of Hands on activities on polar topics that will inform and engage students on polar topics from Sea Ice, Sea Level Rise, Climate Change, Ice Cores, Native Populations. Can be used with any age but are best for Middle School and High School students. |
