Home | Attributes | Heritage | Puzzles
Lamont-Doherty Geoscience Data Puzzles
 We are excited to announce that Data Puzzles are now published as an NSTA Press book, Earth Science Puzzles: Making Meaning From Data. The content on this website describes the attributes and heritage of the Data Puzzles, and supports use of the published puzzles in the classroom. A free sample chapter is available here for download. Visit the NSTA Press Science Store to order the book. Please note there is an error in the book for which a corrected page is provided in this erratum supplement. All known errors are tracked on the erratum page of this site.
 How do we know what the climate was like in the past?
By David McGee, Lamont-Doherty Earth Observatory, and Kim Kastens, Lamont-Doherty
Earth Observatory
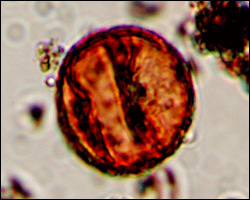
The "Aha"Insights: How do scientists figure out what the
climate of an area was like 500, 1,000, or 10,000 years ago? In this
data puzzle, students use variations in pollen preserved in a sediment core
from a pond to reconstruct past climates in the region. By charting
the evolution of local climate and vegetation from the end of the last ice
age to the present, students are able to visualize past conditions in the region
and to understand how the sedimentary record can be used to learn about the
past.
 How do we decide "weather"
or not to proceed with the trip?
How do we decide "weather"
or not to proceed with the trip?
By Deena Bollinger, South Orangetown Middle School, and Kim Kastens, Lamont-Doherty
Earth Observatory.
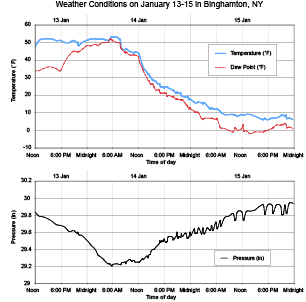
The "Aha"Insights: How does wind influence weather? How
is weather related to air mass? How can we make weather predictions from lines
that show up on a graph? These are just some of the questions students will
address as they examine graphs of temperature, dewpoint and wind direction
for a single weather event to see how to 'read' the weather story. Students
will learn that fronts are the doorway to a weather change; as the leading
edge of an air mass, fronts can signal adjustments in temperature, wind direction
and even precipitation.
 What does an earthquake feel like?
By Kim Kastens, Lamont-Doherty Earth Observatory, and John Armbruster, Lamont-Doherty
Earth Observatory
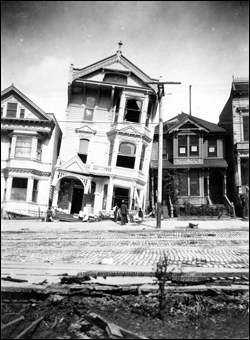
The "Aha"Insights: Students in the Northeast U.S. are often
surprised to learn that earthquakes occur in our region, and that they do not
all occur at tectonic plate boundaries. Students will learn what an earthquake
feels like, when experienced by the human senses and described in everyday
language. The high-tech sensors that scientists use today to record seismic
waves detect the same phenomena that the human senses detected in the historical
newspaper accounts.
 Is
the Hudson River too salty to drink?
Is
the Hudson River too salty to drink?
By Margie Turrin, Lamont-Doherty Earth Observatory, and Kim Kastens, Lamont-Doherty
Earth Observatory
The "Aha" Insights: In this data puzzle, students will
examine three different sources of salinity data collected throughout the Hudson
River Estuary. By
comparing salinity data to a map of the estuary they will see that salinity
drops as you move north away from the Atlantic Ocean. By comparing salinity
and rainfall data for a four-day period at a single location in the estuary,
they will see how a rain event in the watershed forces back the intruding salt
from the Atlantic Ocean. By plotting data on the location of the salt front
for two two-month periods, they will see that salinity at a given location
varies seasonally. In the end, students will
understand that the amount of salt in the estuary is
controlled by the constant input of freshwater from the northern end of the
river system and the salt water intrusion from the Atlantic Ocean.
 Where
did the water go?
Where
did the water go?
By Kim Kastens, Lamont-Doherty Earth Observatory
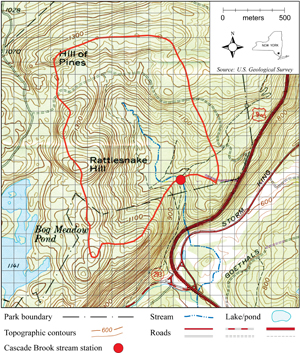
The "Aha" Insights: In this Data Puzzle, students compare
the amount of water that fell in a watershed over the course of one year with
the amount of water that exited from the watershed via the outflow stream.
It turns out that nearly half of the water that fell
onto the watershed didn't flow out through the stream. So, where did it go?
Students can draw on their understanding of the water cycle to hypothesize
that some of the water could have escaped upwards into the atmosphere via evapotranspiration,
or downwards into the soil via infiltration. Students find it surprising that
these "invisible" pathways in the water cycle carry nearly as much
water as the conspicuous pathway of the rushing stream.
 How
much heat is released by a seafloor hydrothermal vent?
How
much heat is released by a seafloor hydrothermal vent?
By Rosemarie Sanders, Ramapo High School, and Kim Kastens, Lamont-Doherty
Earth Observatory
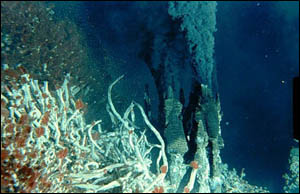
The "Aha" Insights: In this data puzzle, students compare
the amount of heat given off by a hydrothermal vent with the amount of heat
needed to bring kettles of water to the temperature at which water begins to
boil. Understanding that the heat released from one vent in a day would provide
a cup of coffee/tea/cocoa for every man, woman or child in several Northeastern
States helps students to realize that large amounts of heat come from the earth's
interior.
 The
development of Geoscience Data Puzzles has been supported by the National
Science Foundation (NSF) through Grant OCE03-28117 (Data Puzzles #2 and #3)
and Grant GEO06-08057 (Data Puzzle #1). Any opinions, findings, and conclusions
or recommendations expressed in this material are those of the authors and
do not necessarily reflect the views of the NSF.
The
development of Geoscience Data Puzzles has been supported by the National
Science Foundation (NSF) through Grant OCE03-28117 (Data Puzzles #2 and #3)
and Grant GEO06-08057 (Data Puzzle #1). Any opinions, findings, and conclusions
or recommendations expressed in this material are those of the authors and
do not necessarily reflect the views of the NSF.
Last updated December 5, 2012