Hudson River Benthic Mapping Data -
Sidescan Sonar
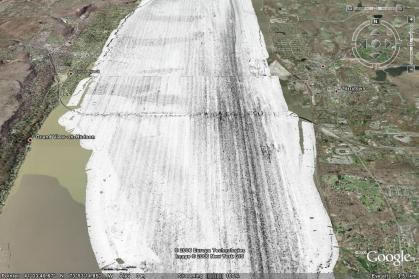
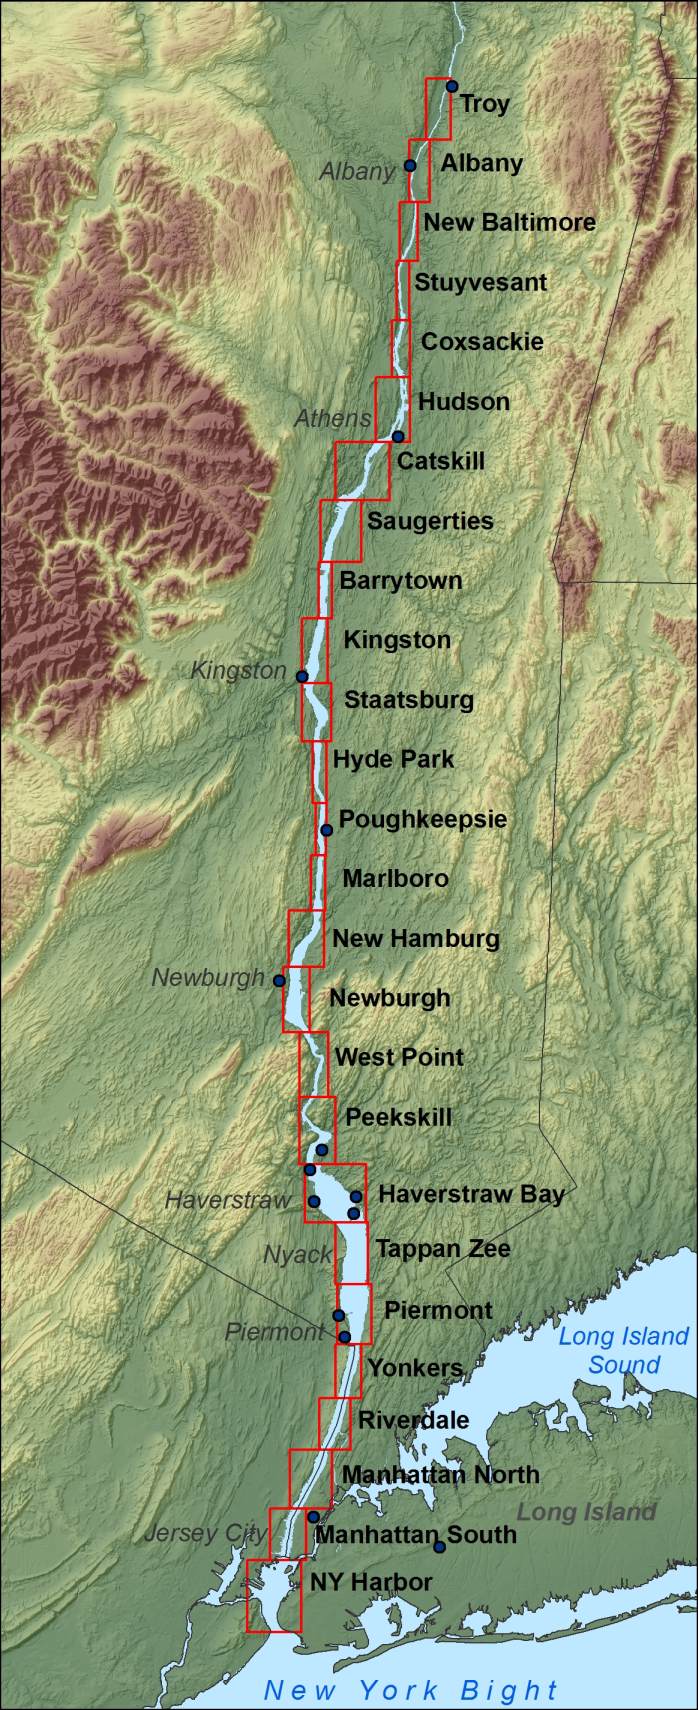
As part of the Hudson River Benthic Mapping Project we collected sidescan sonar data for the tidal Hudson River Estuary from the New York Harbor to Troy, NY. Sidescan sonar image yield information on the character of the river bottom: High backscatter (dark gray) corresponds to rougher and harder bottom such as erosion, sand, or gravel. Low backscatter (light gray) corresponds to softer and smoother bottom such as deposition or muddy bottom. Examples of the processed images can be downloaded and displayed in GoogleEarth. The images are divided into different areas to keep the files small. Just click on an area on the map or the name of the area next to the map to start the download. If GoogleEarth is installed on your computer it might open automatically and display the image.
|