 |
 |
 |
 |
|---|
 |
 |
 |
 |
|---|
Parameters |
|---|
 |
 |
 |
(click on any parameter to jump to that item)
 |
Water chemistry is a controlling factor in the amount and types of fish, macroinvertebrates and even plants that will be able to thrive and exist in a given section of the river. Water chemistry is impacted by adjacent land uses, tides and currents, time of day, time of year, type of substrate and interactions between these variables as well as other more subtle factors. Students should make the chemical measurements, gather the data and then analyze and discuss what it means. Pose questions to each other...Why is this important? Does it have an impact on other things we have noticed today? What might have had an impact on this reading? Would we expect this reading to change it we checked it again in an hour...3 hours...6 hours? |
Dissolved Oxygen (DO) - This is a measure of the concentration of oxygen gas dissolved in water and available for aquatic life. Oxygen enters the Hudson River primarily through diffusion from the atmosphere, turbulence caused by tides, winds and currents, and plant photosynthesis.
Important Facts about DO :
How many of these factors are considerations in our readings today?
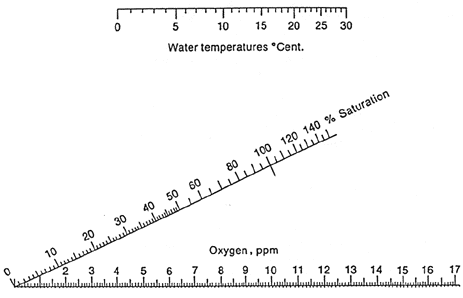
Source of chart: http://waterontheweb.org/under/waterquality/oxygen.html
Salinity is an important and fascinating part of the Hudson River Estuary. Salty seawater from the Atlantic Ocean enters as a wedge using gravity to push its way into the river along the bottom, as freshwater runs downriver washing over the top. The saltwater stays on the bottom since it is denser than freshwater (see image below). Remember 'mass' measures how much there is of something, while density measures high tightly it is packed together. Salinity in the Hudson River estuary ranges from close to seawater (35,000 ppm) at the mouth of Sandy Hook, N.J., to background levels (20-30 ppm) in freshwater further north on the river.
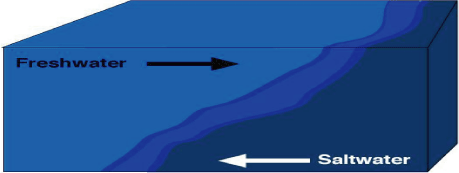
The strength of the saltwater pulse coming from the ocean, or to the volume of freshwater running downriver from the north is not a constant. Seasonally there are rushes of freshwater with rains and snowmelt forcing the saltwater intrusion south, and then periods of hot dry days where freshwater additions lessen and the saltwater pushes north. The area that we consider the transition area is what is called the "salt front", and is measured at 100 mg/L chloride concentration. For the first years of our program the USGS monitored the salt front in the Hudson River and we recorded their salt front location on our data sheets. Beginning in 2012 we combining all our participants' data for Snapshot Day we can determine the approximate location of the salt front in the river for the date. Where do you estimate that transition location will be this Snapshot Day? To learn more about the salt front in the Hudson River try our Salt Front Activity curriculum piece. Another Real Time salinity source in the lower Hudson is available through HRECOS website (select the Pier 84 location).
Why do we care about salinity in the Hudson?
Water Temperature
Water temperature affects the rate of the river's processes, both biological and chemical:
Many factors affect water temperature:
Can you explain why each of these items would have an impact on water temperature? Which of these items will be a factor where you are testing?
If your site has areas that vary in depth, tree cover, plant growth, you might wish to record readings in these different areas. If you are sampling off a pier check the temperature at different depths...is there a difference? If so does this affect any of your other sample readings like DO, nitrates, pH? Why or why?
Turbidity
Turbidity describes the cloudiness or muddiness of the water. A main source of the Hudson's turbidity is directly related to the high sediment load it carries, collecting and depositing mud as the water moves backward and forward along the river channel. While too much sediment is not desirable, a turbid river does not equate to a bad or dirty river that needs to be cleaned. Turbidity can reflect high levels of plankton productivity (both zooplankton and phytoplankton), and large amounts of detritus (or decaying plant material) that is available as a food source for marine and aquatic species. Murkiness can be beneficial in protecting the young-of-year fish from predators. In the Hudson the amount of turbidity will vary in different parts of the river and in relation to several factors including runoff volume, the amount of submerged vegetation, and the amount of productivity.
Humans have had an impact through disturbances of the river banks and river bed, sewage effluent etc. High turbidity can actually raise the water temperature through heat absorption from suspended particles. This can have a harmful impact on plants and marine life. These particles can also clog fish gills. Sediment deposited in channels and along docks may have to be removed by dredging so that ships are prevented from going aground. Both the altering of the river banks through straightening and channelizing, and the dredging, have impacts in the flow, depositing (deposition), and eroding of sediment in the Hudson River.
Several of our protocols will focus on turbidity in your area of the river - you will do a turbidity reading to determine the cloudiness in the water in your area. What percent of that cloudiness is a result of suspended sediments, what percent is detritus and what percent is productivity? That is a difficult question to answer without more sophisticated tests. However, we will be looking at productivity in our next test.
Chlorophyll
We were just looking at turbidity. As we mentioned in the Hudson River turbidity is made up of small bits of plankton, pieces of detritus or decomposing plant and animal matter, and suspended bits of sediment. The measure of all three of these items together is called Total Suspended Solids. In this activity we are looking at just the chlorophyll measure of the solids. The pigment Chlorophyll is what allows plants (and algae) to convert water and carbon dioxide to organic compounds in the presence of light, a process called photosynthesis.
For more on this subject jump to the page on Chlorophyll.
Sediment Sampling
Sedimentation in the Hudson River is a process that is little understood. Geologists will tell us that one of nature's laws suggests that areas that are channeled or dredged by human's will seek to re-establish their prior depth. These areas will tend to accumulate sediments at a faster rate than other areas of the river might. However is this true in the Hudson River? The constant back and forth movement of the river water moves sediments up and down the river in both large waves of sand several meters high, and in smaller swirls of movement. Recent studies have started to piece together a picture of where sediments collect and where deposition seems to occur in the river. One of the ways that we can examine the age of sediment collecting at a given site in the river is to look at the metal content of the sample. To do this sediment samples will be collected and examined.
Short core samples will be collected at several of the sites during Snapshot Day. The sediments in the core represent a period of time with the material at the bottom being older than the material at the top. If material has been accumulating steadily, a sediment core will contain a record of the material transported by the river over time. But how much older, and how much time does this sediment represent? These can be difficult questions to answer. You can not tell how many years your core represents just by looking at it. The amount of time represented by a core will vary depending on the specific place and processes of the river in your area. Sections with high deposition can accumulate sediment in a few days or a year that could represent 10s to 100s of years in other areas.
Where we collect a core we can describe the core just as a scientist would in the field, noting core length; measure and note any changes in sediment color in the core due to oxidation (see image); we can examine the sediment collected to see if it contains pieces of plant material, shells, coal, brick, worms or clams that might represent the river bottom in the area sampled; and we can describe the grain size by texture.
This core sample will then be sent to Lamont-Doherty Earth Observatory for X-Ray Fluorescence (XRF) scanning to determine the amount of lead and other metal concentrations found in the river sediments. Many of these metals are naturally occuring, but high levels of some metals can suggest anthropogenic (or human) influences. For example, lead occurs naturally at rates of approximate 20 ppm in the sediments, but spikes in lead levels are associated with industrialization and leaded gasoline, paint pigments and incinerators. If we find a sample with high levels of lead we would assume it was deposited in the river after 1900, while samples with lower background levels of lead would be believed to have been deposited prior to 1900.
To gather data for research analysis, longer core samples would need to be collected and a series of XRF readings completed down the core. However, a comparison of short core sample readings throughout our sampling sites might provide an interesting opportunity to look at sediment movement in the shallows of the river.
For more on this subject jump to the page on Sediment Sampling.
Tides and Currents
Tides - The estuary section of the Hudson River is subject to a tidal cycle. In the Hudson every 6 hours the tides will shift pushing water into the river mouth from the Atlantic Ocean on a flood tide, and pulling water back out the mouth on an ebb tide. The image below shows a student setting a tidal marker just off the edge of the Piermont Pier so that he can monitor the tidal cycle during his time at the pier. The second image shows the same area focusing on extent of the tidal retreat during the ebb tide.
Ranges - The vertical tidal range (the difference in height between high tide and low tide) varies with where you are in the river. In the midriver section the tidal range can be less than 3 feet, while the range at the Troy dam can be close to 5 feet. The vertical tidal range can also vary with the stage of the moon. When the sun and moon are aligned there is a strong gravitaional pull. This alignment occurs with both a full moon, when the Earth is between the sun and the moon, and a new moon, when the moon is between the sun and the Earth. The strong gravitational pull causes very high and very low tides resulting in a larger tidal range. These tides are called spring tides. During the mooon's quarter phases the gravitational pulls cancel out and the tidal ranges are at their lowest. In some sections of the river this can be as low as 1 foot!
Tidal ranges can affect the plants and animals that can live in a specific area of the river. At the north side of the Piermont pier extensive mud flats are exposed during lowtide. What does this mean for the plants and animals that inhabit this part of the estuary?
Measuring Tides - You will be recording if the water level is rising and falling. If you are working from a pier you will be measuring down from the surface or the railing to the water level, or to a notable marking on a pier support, boat or other item. Record your observation. You will continue to make this meaure every 15 minutes to see if there is a change. If you are working from shore you will have a tide stick to set. If you have a measured stick you can determine how quickly the tide is advancing or retreating over a timed period by setting the stick in the water and then reading and recording the markers every 15 minutes. Make sure you record the times with your readings! Be careful when you do your measuring that you don't record wave activity. Sometimes boats or wind can cause the waves to rise up and confuse the reading. By being careful and observant you will avoid this confusion.
Currents - The difference in elevation between high and low tides creates tidal currents. The timing of these currents mimics the rise and fall of the tides, following roughly a six hour schedule. Extremes in weather, such as excessive rains or strong winds, can impact the currents by overwhelming or suppressing them. In some places on the river, change in water color can reflect the current (see the white line of the current in the image below). Generally the current can be evaluated by watching something float on the river. We will float a popsicle stick or tongue depressor to examine the currents, timing them as they pass a through a measured distance. If a current is moving in your area, you can determine the speed by computing the centimeters travelled per second and dividing by 50 (knots = cm/sec divided by 50) . 1 knot is equal to 1 nautical mile (~6076 feet) per hour. Note: Is the current moving into the river from the Atlantic (flood), or moving out of the river (ebb), or is it holding fast (slack)?
As a result of tides and currents, the Hudson does not flow in one direction. Because the ebb tide is stronger than the flood tide, the river does ultimately flush itself, but residence time in the river can vary depending on the season and can take up to 4 months! During the summer months water residence time in the river increases; can you think of why this would be the case?
Fish and Macroinvertebrates
The Hudson River is full of a wide variety of fish and macroinvertebrates. Of course certain fish and certain macros will prefer different types of environments:
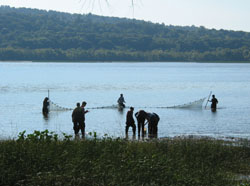
Some species prefer different environments at different times of the year, or in different stages of their lives. Identifying the type of fish and the volume of each type per catch (seine or other type) provides a picture of what marine life inhabits each area of the river.
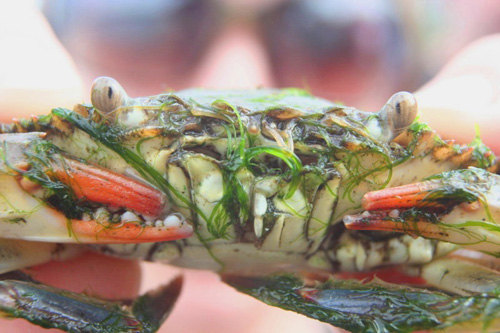
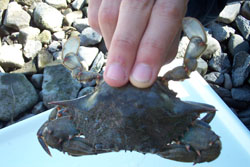
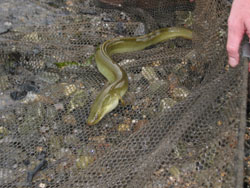
Can you identify the Hudson River "residents" pictured below and determine if they live in fresh or saltwater? You're right; you might need more information...like whether they are male or female, or what time of year it is!
 |
 |
Many types of plant communities exists in the Hudson River including two that deserve special mention:
Do you have submerged aquatic vegetation in your area? Can you determine what kind of SAV it is (Pull one out and match it to a picture if you need to)? List what you can identify using the Hudson River Field Guide to Plants of Freshwater Tidal Wetlands. Can you determine what the percent coverage is in your area (roughly 20, 40, 60, 80 or 100% cover)? Can you tell if it is being used by fish and macroinvertebrates?
One of our threatened areas is our high marsh areas. Many of our native grasses like Chairmaker's Rush (or Three-square pictured here) and Spartina grass are being replaced by dense stands of common reed or Phragmites.
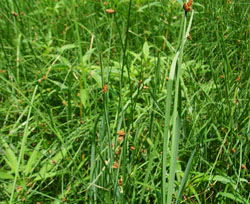
Are there plants growing around the area where you are sampling? If so define whether you think they are low marsh or high marsh. Again using the Hudson River Field Guide identify as many types of plants as you can and list the percent composition of each type of plant you see. Draw samples of each type of plant you do not recognize by name so you can find their names when you get back to school.
The scientific community has not agreed on a cause for the prolific expansion of common reed in the Northeast. Can you come up with some potential causes? What are some concerns for having monotypic (single species) stands of plants?
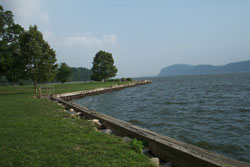
The shoreline, adjacent area, adjacent land uses and land forms are all useful in evaluating your data. Things to consider are:
Photographs of the site are wonderful, but it is also useful to have the students sketch a map of their site. By sketching the site they will more carefully assess the factors that may contribute to some of the chemical readings and sedimentary information gathered during the day.

Different types of maps and images offer unique pieces of information that can be used to better understand your collected data. Topographic maps can provide information on the overall steepness & drainage, as well as some very general depth information on the river bottom depths in the area of your sampling. Aerial/satellite maps provide a broad overview of land use in your sampling area which should be considered in the broader impact of land use in the anaylsis of the data. Nautical Charts are graphic portrayals of the marine enviroment and are essential for navigating the river. These charts give information on water depth, locations of light houses, navigational bouys and other esssential boating information. For many areas of the river we have access to underwater imaging of the subsurface from a recent underwater mapping project. This page includes short movies made of the underwater data allowing you 'fly' through the landscape. Informational powerpoints provide infomation on river morphology,unique features in the river bottom in different areas of the river, and more. These data layers add a new depth of information to each piece of the river studied.
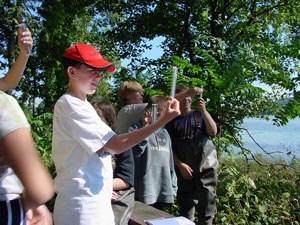
Weather can have a large impact on your Snapshot Day results. Air temperature, cloud cover, wind speed (meaured using Beaufort's chart) and direction, precipitation both on Snapshot Day and two preceeding days. Can you think of what readings you have done that might be affected by any of these items?
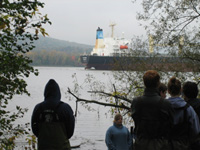
The Hudson River is a working river. During the course of the day boat traffic will be seen moving cargo up and down the river. We are able to track a vessel's progress by each group logging: the time, type of ship, name of ship, Southbound/Northbound, loaded/light, cargo. Using this data groups can run calculations on speed of these vessels as they navigate the river.