|
|
|
|
|---|
| Home | Background | Workshops | Resources | Parameters | Science Partners | Data | Lesson Plans |
|---|
*NEW Check out our 2021 "Is The Hudson a River or an Estuary" 3 Part Investigation for Middle & High Schoolers!
| All Ages | 3-5 grade | 4-7 grade | Middle School | High School | Annual Activity Sheets |
Lesson plans using data students collect themselves can be exciting! Below you will find several lesson plans based on our A Day in the Life activities and results sorted by grade from elementary to high school. These activities are a great way to prepare for your annual A Day in the Life event, or to wrap up after the event. Many of these activities can be updated by replacing the data used with current year data. More Hudson River focused lesson plans developed by the Hudson River Estuary Program.
Curriculum Title |
Teacher Background |
Grade Level |
|
|---|---|---|---|
 |
Review with your students some of the key vocabulary from this event BEFORE you venture out to the river |
Good Student Preparation for the field experience |
Adaptable to all ages |
 |
A pre-event activity for A Day in the Life'. We encourage students to complete this predictions worksheet in order to consider the different parameters they will be measuring at their study site. After the event students compare their data to their predictions! |
Adaptable to all ages |
|
 |
Data Visualization Hudson River Salinity 2008- Dry Fall River Salinity 2009 - Wet Fall Salinity In these two 'Data Visualization" activities salinity data collected on two Day in the Life events are marked on an estuary map. Students color and interpret the map according to the data - teacher notes point out some discussion points. |
Consult the Teacher Background information for how to split your students into two groups to enhance this activity. |
Adaptable to all ages |
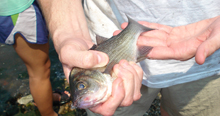 |
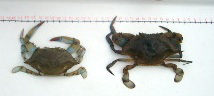
Compare Fish Catches at 3 locations in the estuary - does salt affect the catch? Look at data from a summer workshop & place the fish in the right salinity - pdf version. |
Uses Venn diagrams download ppt version |
All Ages |
 |
Fish Above & Below the Salt Front Examine data from the 2010 A Day in the Life Event to assess salinity preferences of fish in the Hudson River. |
All ages |
|
 |
Use word problems to interpret graphs and maps to interpret data on the interactions between salt water and fresh water. |
3-5 Grades |
|
 |
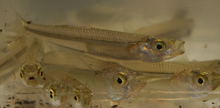
Uses tables and graphs to interpret organized observations and measurements from fish seining data from A Day in the Life. |
3-5 Grades |
|
 |
A background reading on the geography and natural history of the Hudson River followed by data based questions to assess understanding for an English Language Skills activity. |
3-5 Grades |
|
 |
Look at data from A Day in the Life to determine where the Salt Front was for the day |
4-7 Grades |
|
 |
Look at fish seining data from A Day in the Life to examine fish habitats and behavior |
4-7 Grades |
|
 |
Sea Level Rise: A Field Activity
Developed through NYS Sea Grant for use on an estuary of ocean coastline. Looks at present sea level and predicted future sea level based on the International Panel on Climate Change (IPCC) estimates, NGSS aligned. Full activity & supplies list. |
Middle School & High School | |
 |
Is the Hudson a River or an Estuary: High School / Middle School Students create models of a river and an estuary that they refine through a 3 part investigation looking at fish, salinity levels and tides in the Hudson. PPTs and lesson plans all linked above. Investigaton in 3 parts. Download three instructional ppts: Part 1 - Part 2 - Part 3 |
Middle School & High School Versions Avaialble | |
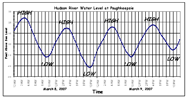 |
Examine tides and tidal cycles. This activity uses graphs and charts from the Hudson River Ecological Observing System (HRECOS) a network of real time monitoring stations in the Hudson River. |
Middle School |
|
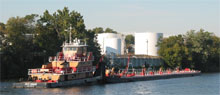 |
Multiplication/Division with Shipping Data Use real data from Snapshot Day ship travel to calculate speed of transit and more |
Middle School |
|
 |
Scientific Method - Oh that! Look at how setting up a study can determine what you learn, and how useful it is |
Middle School & High School |
|
 |
This activity explores 2 questions: (1) In the absence of technical models, what biological indicators of the salt front might we rely on? (2) How do ‘Day in the Life’ student-collected data compare to USGS model results? You will need the Salinity and the Fish datasheets: Salinity & Fish. |
Teacher Background | High School |
 |
Graphing the Salt Front Activity Examining data for a 12 month period, see how the salt front moves in the river |
High School Middle School |
|
 |
Interpreting Your Data Worksheet Useful for field discussion or analysis on how to look at the data you collected |
High School Middle School |
(Activities provided in pdf format - If free downloadable software for viewing is needed please click on the adobe icon)