
|
|
|
|
|---|
| Home | Background | Workshops | Resources | Parameters | Science Partners | Data | Lesson Plans |
|---|
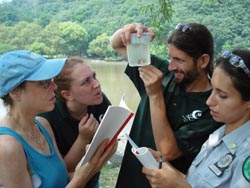
Exploring the data collected from Snapshot Day Events
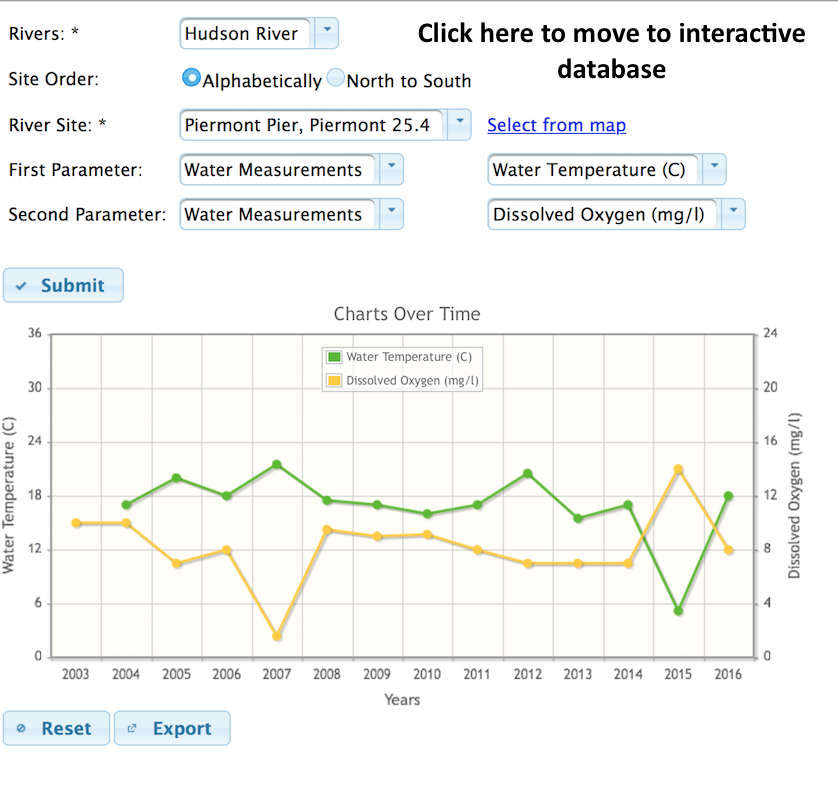
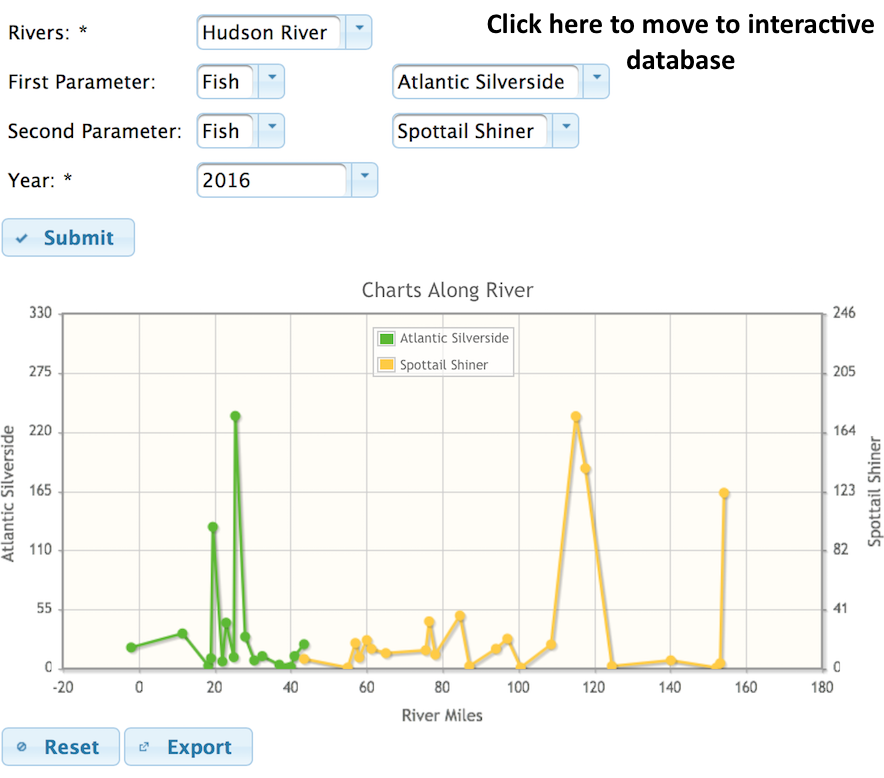
Each Snapshot Day Site gathers data on Physical, Chemical and Biological parameters. Data is then organized so that participants and educators can view results by sampling site, by sampling parameter, or by seeing how each site fits into the rest of the Hudson River. There are several ways to review the data. You can go straight to the sampling year pages to view the data for each year, or you can use the interactive database below. The top database focuses on comparing sites along the river for a selected year. The bottom database focuses on how sites have varied over time. Hoovering over a datapoint provides the year and number represented in the parameter. You can zoom in on a section of the graph by selecting an area with your cursor. Finally, you can download the graph as a png file.
LINK TO: Metadata Page and Each Year's Summary Data Activities
LINK TO EACH YEAR'S FULL SET OF DATA
LINK TO CHART ALONG RIVER OR CLICK ON GRAPHIC
LINK TO CHART OVER TIME OR CLICK ON GRAPHIC